. 2013 May 21;2:e00537. doi: 10.7554/eLife.00537

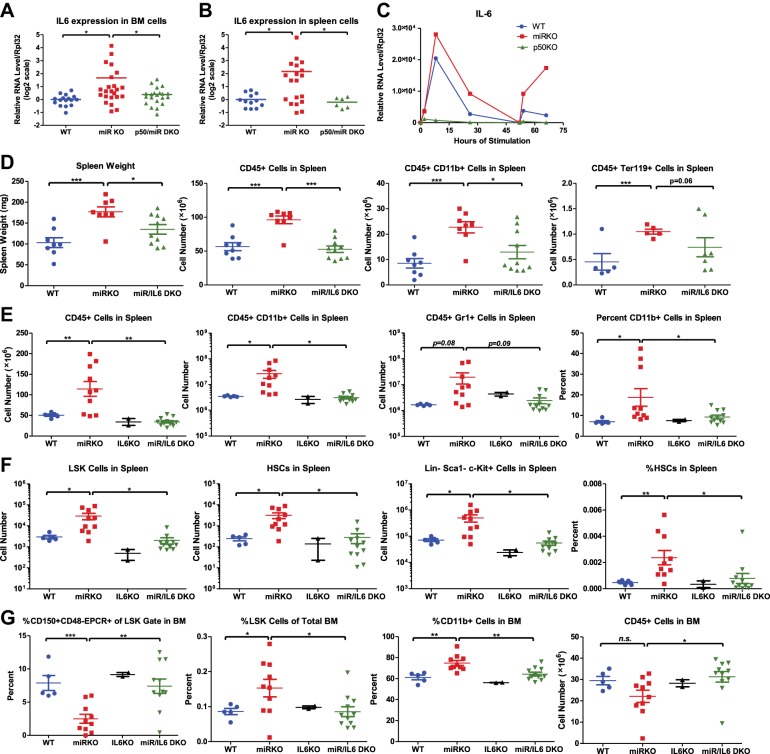
Figure 6. NF-κB-regulated pro-inflammatory cytokine IL-6 is an important driver of HSC depletion and myeloproliferation.

Gene expression of IL-6 in bone marrow cells (BM) (A) and spleen cells (B) of aging WT, miR KO, and miR/p50 DKO mice measured by RT-qPCR. All mice are age- and sex-matched 6- to 10-month-old female mice. Gene expression of IL-6 (C) in bone marrow–derived macrophages (BMMs) stimulated in vitro with LPS (100 ng/ml) measured by RT-qPCR. First stimulation with LPS was given at 0 hr and restimulation at 48 hr. BMMs are generated from 8-week-old WT, miR KO, and p50 KO mice. (D) 2-month-old WT, miR KO, and miR/IL6 DKO mice after repeated intraperitoneal injection of LPS (3 mg LPS/kg body weight on day 1, 3, 5, and 7) and mice were harvested on day 8. Spleen weight and total number of CD45+, CD45+CD11b+, and CD45+ Ter119+ cells in spleen were shown. (E)–(G) Age- and sex-matched WT, miR KO, IL6 KO, and miR/IL6 DKO mice were allowed to age to 6–7 months before harvested for FACS analysis. (E) Quantification of number of CD45+, CD45+CD11b+, CD45+Gr1+, and percent of CD11b+ cells in spleen. (F) Quantification of number of HSPCs, including LSK cells, LSK CD150+CD48 HSCs and LincKit+Sca1 myeloid progenitor cells, in spleen and percent of HSCs in spleen. (G) Quantification of percent of CD150+CD48EPCR+ HSCs of LSK gate, LSK cells of total BM, and CD11b+ cells of total BM and total number of CD45+ cells in BM.

DOI: http://dx.doi.org/10.7554/eLife.00537.013

Figure 6.

Figure 6—figure supplement 1. NF-κB–regulated proinflammatory cytokine IL-6 is an important driver of HSC depletion and myeloproliferation.

Figure 6—figure supplement 1.

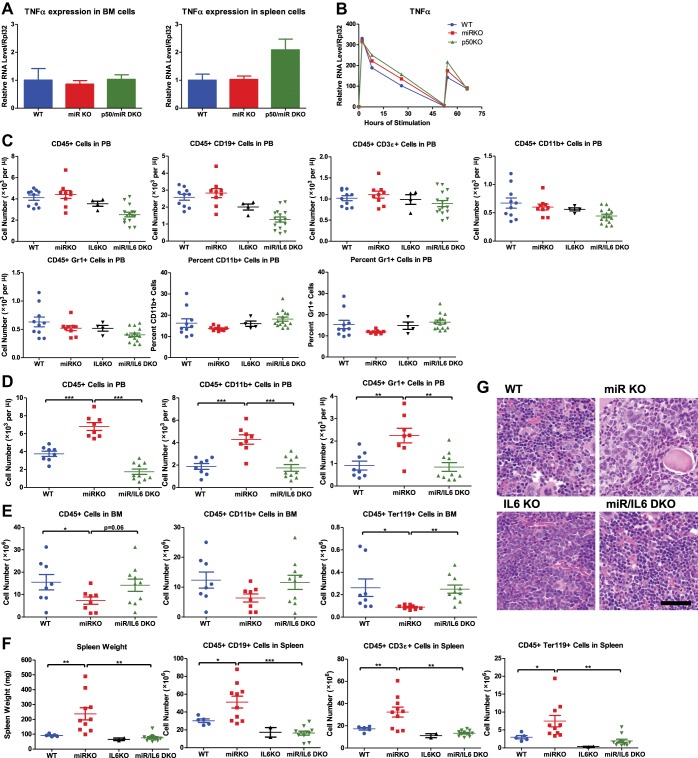
(A) Related to Figure 6A,B. Gene expression of TNFα in BM cells and spleen cells of aging WT, miRKO, and miR/p50 DKO mice measured by RT-qPCR. All mice are age- and sex-matched 6- to 10-month-old female mice. (B) Related to Figure 6C. Gene expression of TNFα in bone marrow–derived macrophages (BMMs) stimulated in vitro with LPS (100 ng/ml) measured by RT-qPCR. First stimulation with LPS was given at 0 hr and restimulation at 48 hr. BMMs are generated from 8-week-old WT, miR KO, and p50 KO mice. (C) Unperturbed 2-month-old WT, miR KO, IL6 KO, and miR/IL6 DKO mice were bled for FACS analysis. Quantification of total number and percent of various cell lineages in peripheral blood under steady state. (D) and (E) Related to Figure 6D. 2-Month-old WT, miR KO, and miR/IL6 DKO mice after repeated intraperitoneal injection of LPS (3 mg LPS/kg body weight on day 1, 3, 5, and 7) and mice were harvested on day 8. (D) Quantification of total number of CD45+, CD45+CD11b+, and CD45+Gr1+ cells in peripheral blood (PB). (E) Quantification of total number of CD45+, CD45+CD11b+, and CD45+Ter119+ cells in bone marrow (BM). (F) and (G) (related to Figure 6E–G. Age- and sex-matched WT, miR KO, IL6 KO, and miR/IL6 DKO mice were allowed to age to 6–7 months before harvested for FACS analysis. (F) Quantification of spleen weight and total number of CD45+CD19+, CD45+CD3ε+, and CD45+Ter119+ cells in spleen. (G) Representative histological pictures (H&E stain) of femur bones. Scale bar, 40 μm.