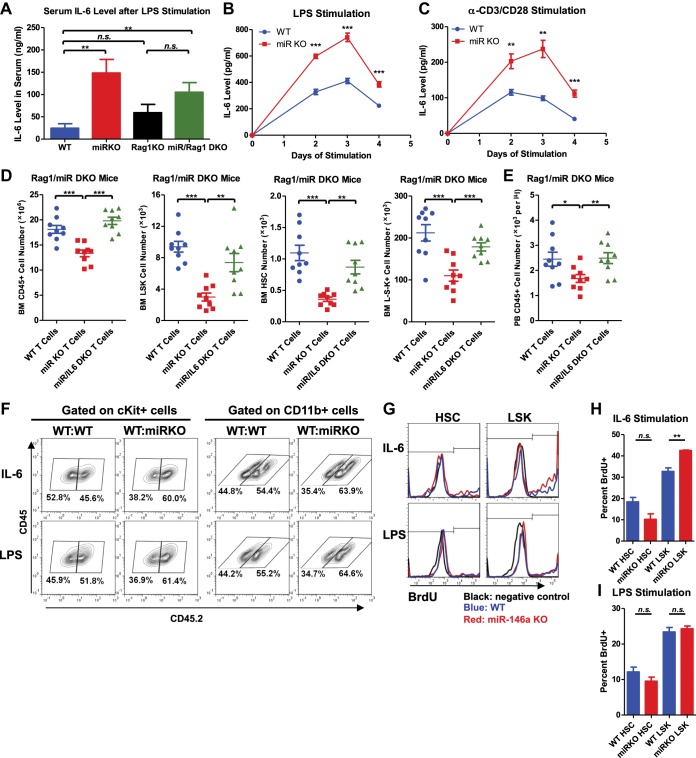
Figure 7. Analysis of cellular source and direct cellular target of IL-6.
Serum level of IL-6 measured by ELISA in 2-month-old WT, miR KO, Rag1 KO, and miR/Rag1 DKO mice stimulated with LPS (1 mg LPS /kg body weight) intraperitoneally for 6 hr (A) IL-6 concentration measured by ELISA in the culture medium of splenocytes stimulated in vitro with LPS (10 μg/ml) (B) or anti-CD3 (1 μg/ml)/anti-CD28 (0.5 μg/ml) antibodies (C) for 4 days. (D) and (E) CD3ε+ T cells were purified from spleens of 10-month-old WT, miR-146a KO (miR KO), or miR/IL-6 DKO mice. 4 million T cells per mouse were transplanted into 10-month-old miR/Rag1 DKO mice intravenously. miR/Rag1 DKO mice were harvested 1 month after transplant for FACS analysis of white blood cells and HSPCs of bone marrow (D) and/or peripheral blood (E). (F) cKit+ cells were purified from bone marrow of 8-week-old CD45.1+ WT and CD45.2+ WT or miR-146a KO mice. A 1:1 mixture of CD45.1 WT/CD45.2 WT or CD45.1 WT/CD45.2 KO cKit+ cells were co-cultured under IL-6 (50 ng/ml) or LPS (100 ng/ml) stimulation for 3 days. Percentages of CD45.2+ cKit+ or CD11b+ were analyzed by FACS. (G)–(I) LSK cells or long-term HSCs (LSK CD150+CD48−) were sorted from 8-week-old WT or miR-146a KO mice and were cultured in separate wells with IL-6 (50 ng/ml) or LPS (1 μg/ml) stimulation in the presence of BrdU (50 μM). After 18 hr, cells were analyzed for cell surface marker expression and BrdU incorporation by FACS. Representative FACS histograms of BrdU status of HSCs or LSK cells. Negative control represents identically gated and stained cells in the absence of BrdU pulse (G). Quantification of percent BrdU+ HSCs or LSK cells under IL-6 (H) or LPS (I) stimulation.

