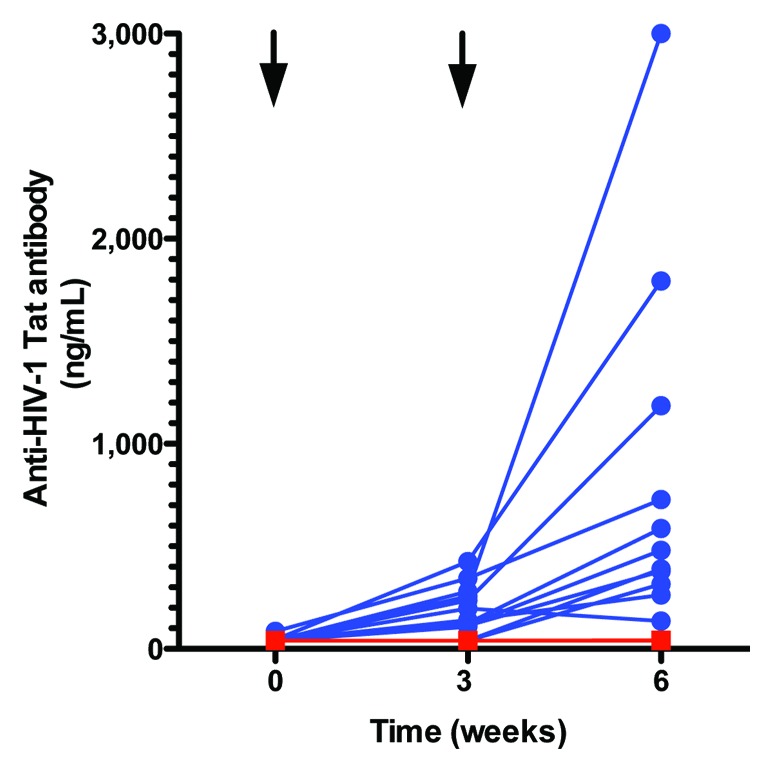
Figure 3. Changes in anti-Tat antibody levels after TUTI-16 (blue) or placebo (red) injections. Arrows denote injection times. The blue lines and symbols represent individual vaccinated subjects. The red line and symbols show the non-responsiveness of the placebo group and two non-responding vaccine subjects are concealed behind this line. TUTI-16 induced antibody levels < 40 ng/mL were previously shown to lower plasma HIV levels in asymptomatic ART naïve HIV infected subjects.18
