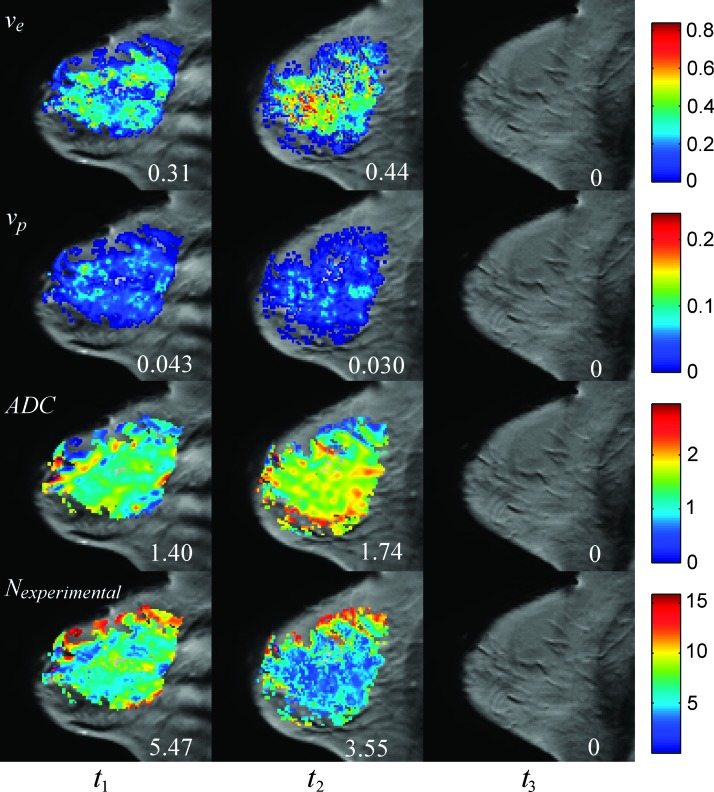
Figure 1.
Parametric maps overlain on sagittal, T1-weighted anatomic scans for a pCR patient at each time point (one time point per column). The first row shows the ve obtained before therapy (t1), after one cycle of therapy (t2), and at the conclusion of therapy (t3). Similarly, the second row shows the vp, the third row shows the ADC maps (x10-3 mm2/s), and the last row shows the number of tumor cells (calculated using the bottom relation in Equation 5) in each voxel (x105) at these same time points. The numbers in each column represent the median values of each parameter.

