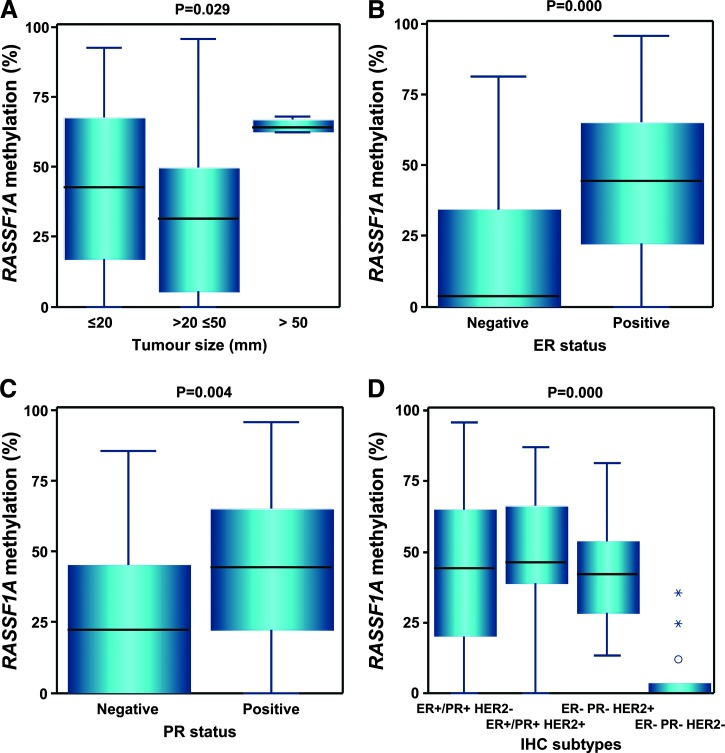
Figure 3.
Distribution of RASSF1A methylation levels in four clinical and histopathologic categories of breast cancer patients. Box plots show the significant differences in the subgroups of patients with different tumor sizes (A), negative and positive estrogen or progesterone status (B and C), and different IHC subtypes (D). The length of the boxes is the interquartile range (IQR) that represents values between the 75th and 25th percentiles. Values more than three IQRs from the end of a box are labeled as extreme (*). Values more than 1.5 IQRs but less than 3 IQRs from the end of the box are labeled as outliers (O). The median is depicted by a horizontal line.

