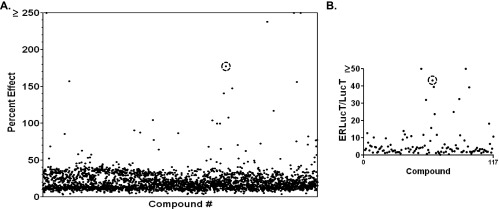
Figure 2.

HTS of NCI compound libraries. (A) Primary screens of 2802 compounds from the NCI Diversity, Mechanistic, and Natural Compound libraries were screened at 10 µM using the D54-ERLucT cell line. The activity of each compound relative to Tn is plotted. (B) Secondary screen of 117 compounds in the D54-LucT cell line, a false-positive screen for nonspecific luciferase activators. Y-axis represents the ratio of primary/secondary screen activity (ERLucT/LucT ratio). Acm is circled in A and B.
