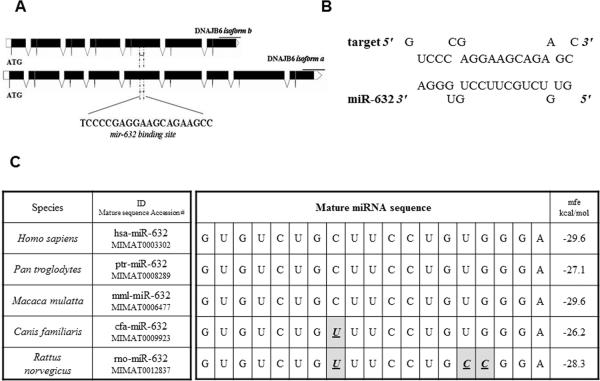
Figure 3. Analysis of miR-632 binding site from DNAJB6.
(A) Diagrammatic representation of miR-632 binding site. Solid black boxes represent exons.
(B) Diagrammatic representation of binding of miR-632 seed sequence to its target site in DNAJB6.
(C) Cross species sequence comparison miR-632. Highlighted boxes with bold italicized underlined letters depict deviation from human miR-632 sequence. mfe = minimum-free energy.

