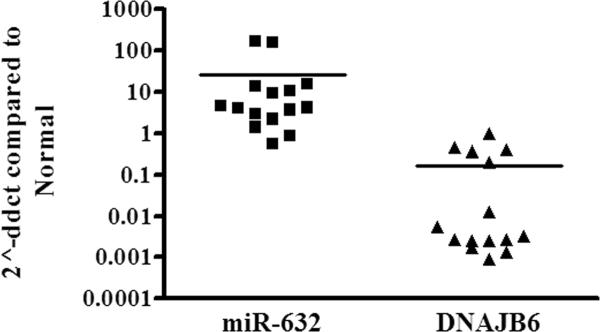
Figure 4. hsa-miR-632 and DNAJB6 levels show inverse trends in breast cancer tissues.

Total RNA from 15 breast tumors was analyzed by qRT-PCR for miR-632 and DNAJB6 levels from. The levels were compared with average of normal levels as calibrator, designated as 1. The graph is presented in logarithmic scale for Y-axis.
