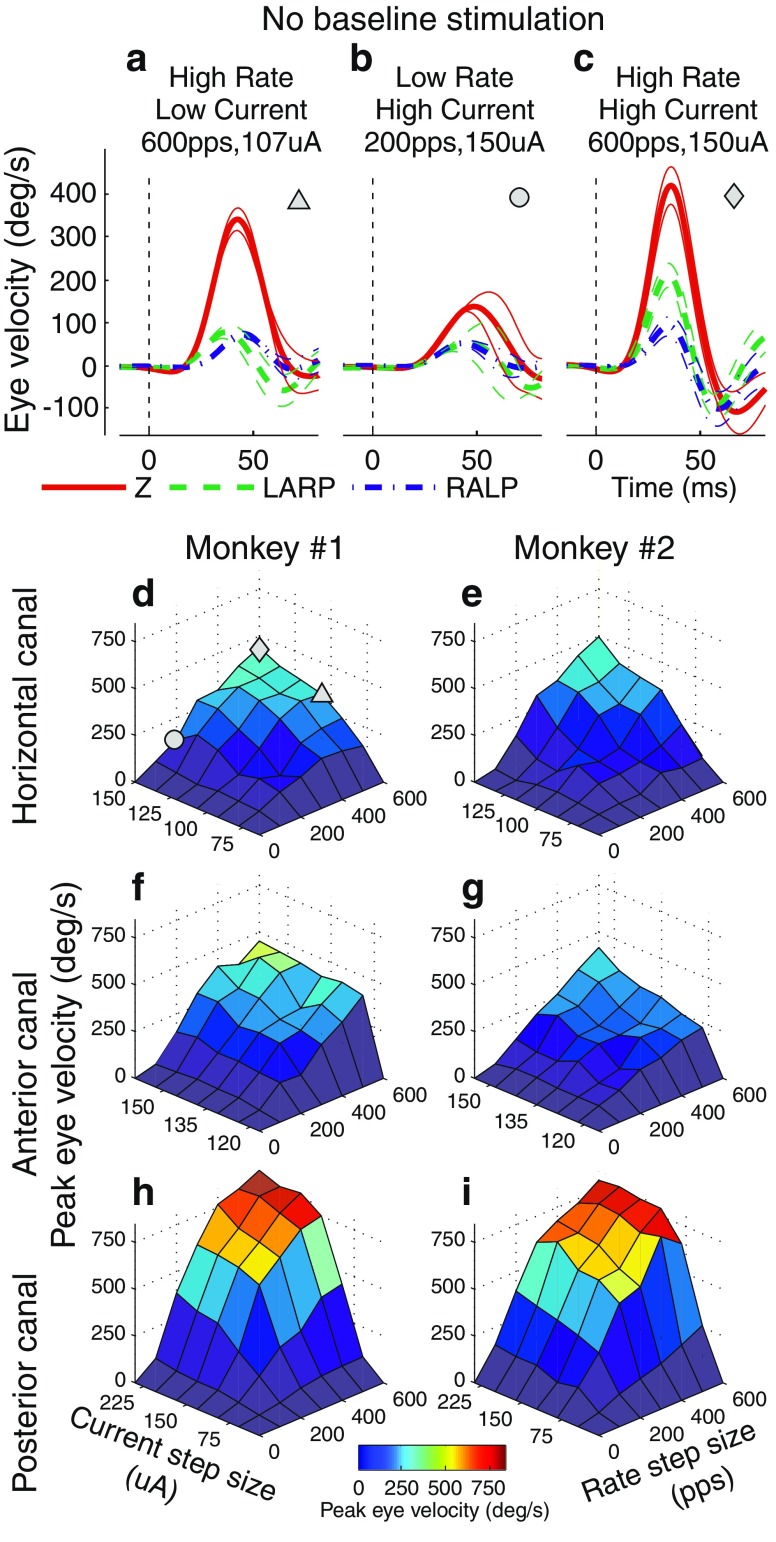
FIG. 2.
A–C Examples of cycle-averaged eye movements for animal 1’s left horizontal semicircular canal in response to stimulation steps from a zero baseline (0 pps, 0 μA,) to (600 pps, 107 μA) (A), (200 pps, 150 μA) (B), and (600 pps, 150 μA) (C). All pulses were 150 μs/phase, biphasic, symmetric, and charge balanced. Eye responses are displayed as mean (thick trace) ± SD (thin traces) for eye rotational velocity components about Z (red, solid trace), LARP (green, dashed trace), or RALP (blue, dot–dashed trace) axes. Dashed lines indicate stimulus onset. D–I Surface plots of peak eye velocities of responses to 36 unique stimulation steps in pulse rate and pulse current amplitude from a zero baseline (0 pps, 0 μA). Three of these responses are depicted in panels A, B, and C and correspond to the triangle, circle, and diamond in panel D, respectively. Peak eye response velocities increase with rate and with current amplitude. Responses are shown for all three tested semicircular canals for both tested monkeys.

