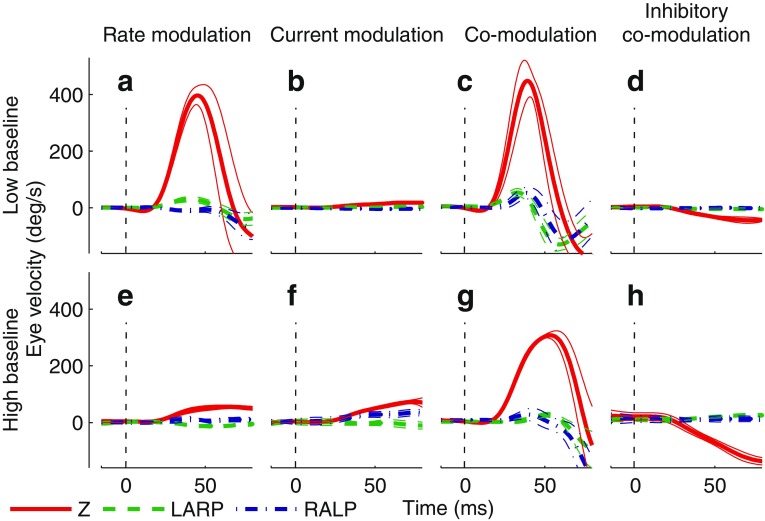
FIG. 3.
Cycle-averaged eye response traces following adaptation of animal 1’s left horizontal SCC ampullary nerve to baseline stimulation rate and current of 94 pps, 107 μA (A–D) or 200 pps, 121 μA (E–H). Eye responses are displayed as mean (thick trace) ± SD (thin traces) for eye rotational velocity components about Z (red, solid trace), LARP (green, dashed trace), or RALP (blue, dot–dashed trace) axes. The dashed line indicates stimulus onset time. A, E Step in pulse rate to 600 pps (maximum delivered pulse rate) while current was held constant. B, F Step in current to 150 μA (maximum delivered current amplitude) while pulse rate was held constant. C, G Step in both pulse rate and current up to 600 pps, 150 μA. D, H Step in both pulse rate and current down to (0 pps, 0 μA). Rate modulation down to 0 pps and current modulation down to 0 μA are mathematically identical to co-modulation down to 0 pps, 0 μA, since no stimulation can be delivered when either the pulse rate or current amplitude is 0. Compared to either rate-only or current-only modulation, co-modulation yielded largest excitatory and inhibitory eye movements regardless of baseline. Considering the goal of effectively encoding both excitatory and inhibitory head rotations, co-modulation from a high baseline yielded the best overall performance. Although responses to excitatory stimuli in this condition were less robust than observed for the low-baseline paradigm, responses for inhibitory stimuli (i.e., down-modulating both pulse rate and current amplitude from a high baseline) were more robust than those achieved with the low-baseline paradigm, with responses approaching 3,000 °/s2. In some cases, stimulus duration and intensity were sufficient that the resulting slow-phase VOR eye movement drove the eye to near its range of motion limit shortly after modulation onset. As a result, the downward deflections seen in A, C, and G represent nystagmus quick phases.

