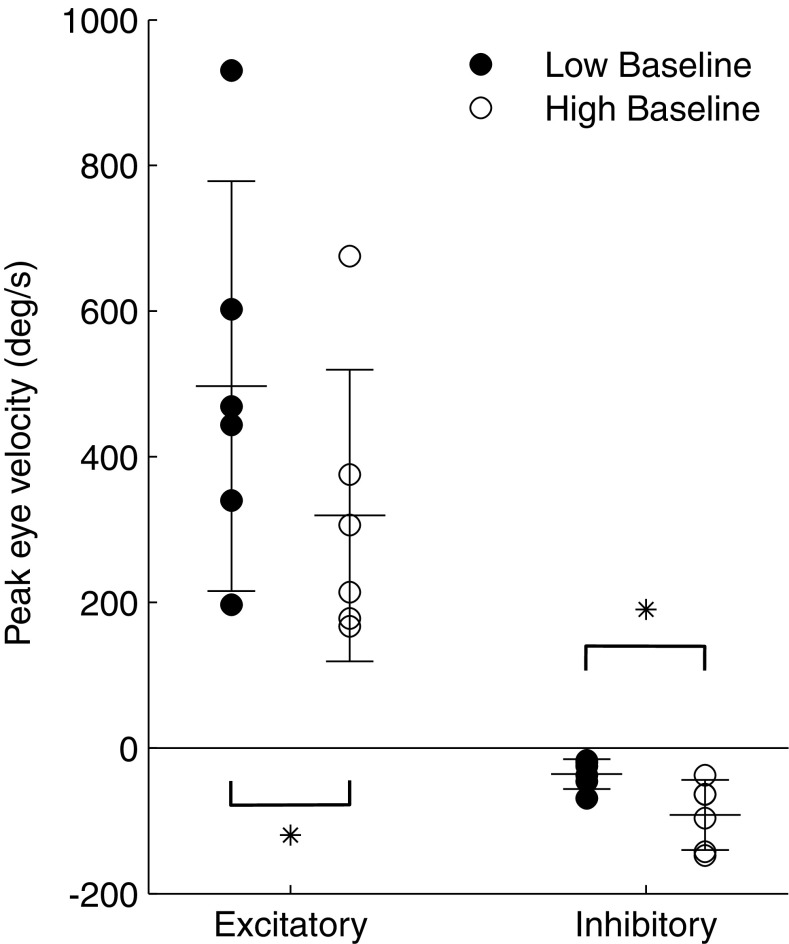
FIG. 4.
Peak eye velocities from each of six tested SCCs in response to co-modulation above (excitatory) or below (inhibitory) either low or high baseline stimulation that the monkey was adapted to. The trends observed in Fig. 3 for one SCC were consistent for all six. At high baseline, excitatory velocity was smaller but inhibitory velocity was larger. * represents significant difference between two datasets at the p < 0.01 level (paired t test).

