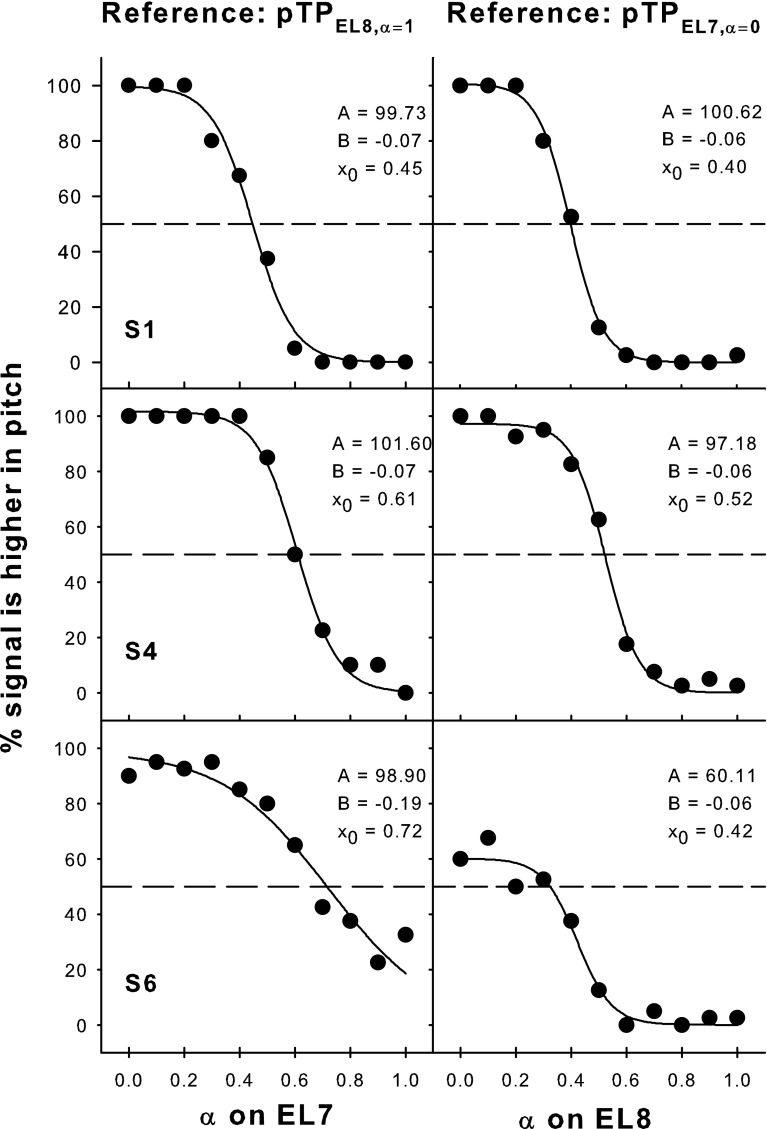
FIG. 12.
Pitch-ranking results between EL7 and EL8 for subjects S1, S4, and S6. The left column shows the percentages that signals on EL7 (pTPEL7, α=0, 0.1, …, 1) were judged as higher in pitch than the lowest-pitch reference on EL8 (i.e., pTPEL8, α=1). The right column shows the percentages that signals on EL8 (pTPEL8, α=0, 0.1, …, 1) were judged as higher in pitch than the highest-pitch reference on EL7 (i.e., pTPEL7, α=0). The solid curves show the best-fit sigmoid functions for the data (solid circles), with the function parameters indicated in each plot. The dashed lines correspond to 50 % responses on the function where the signal and reference were matched in pitch.

