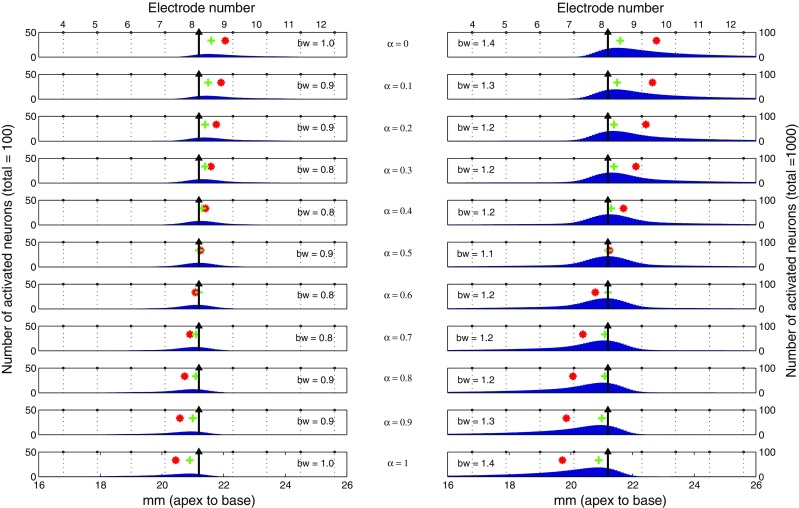
FIG. 4.

The number of activated neurons (blue bars) calculated from the computational model is displayed as a function of cochlear position for different α (rows) and different activated neuron counts (left column: 100; right column: 1,000). Except for the main electrode (EL8, black arrow), electrode positions are shown in dotted lines and their numbers are labeled on top of each column. Also shown for each excitation pattern are its bandwidth (bw: the width of excitation in millimeters at 75 % peak value) and the location of peak (green cross) and centroid (red asterisk).
