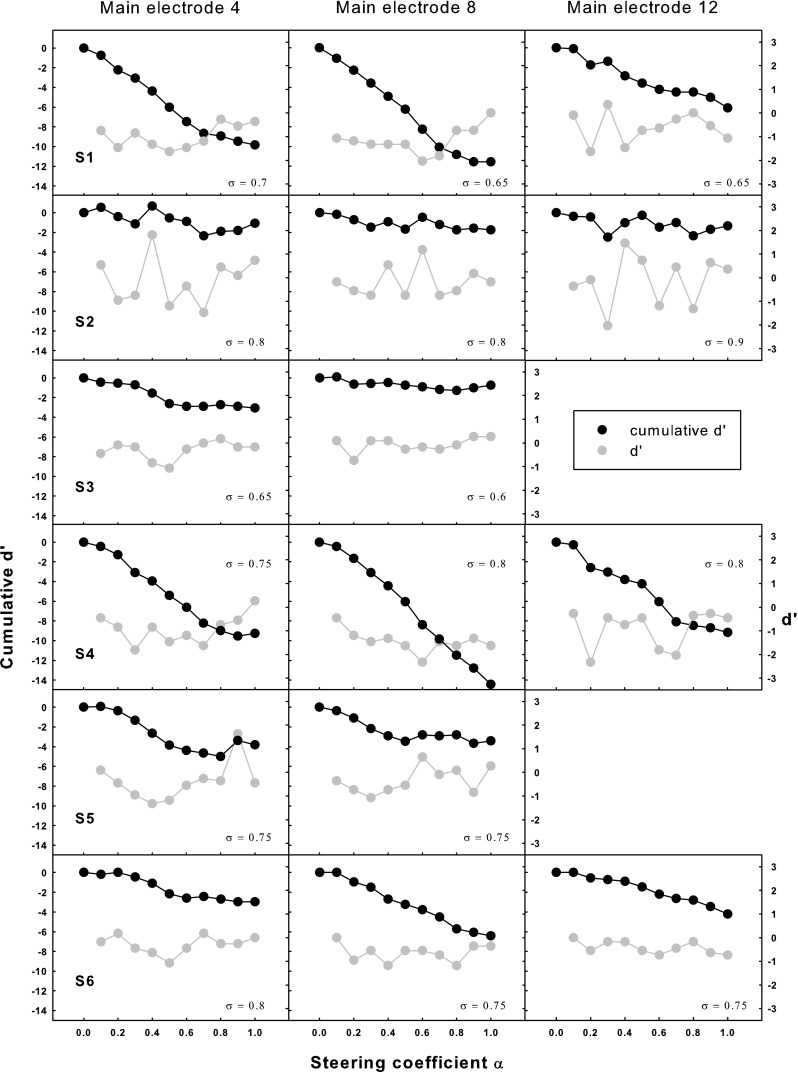
FIG. 9.

Cumulative d′ from α = 0 (black circles; left ordinate) and d′ values between adjacent α (gray circles; right ordinate) for pitch ranking as a function of the steering coefficient α for individual subjects (different rows) and main electrodes (different columns). The applied compensation coefficient σ is shown in each plot.
