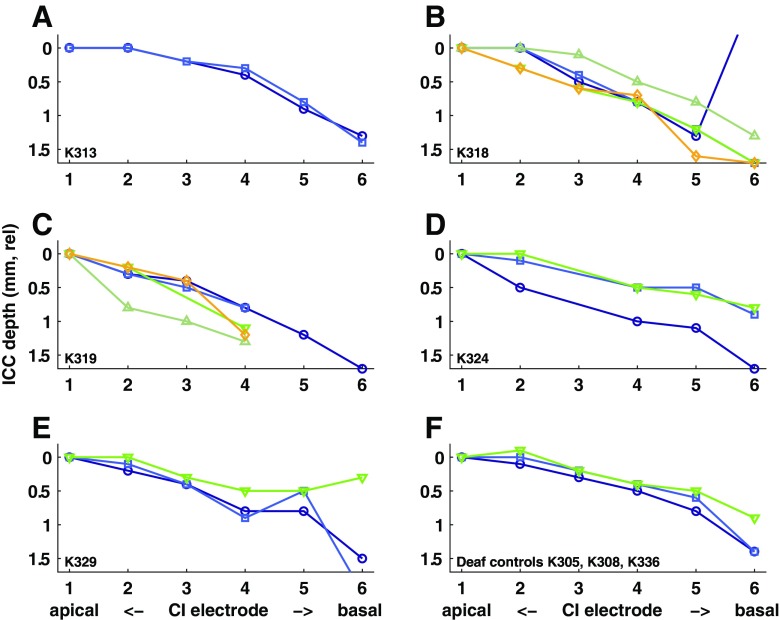
FIG. 12.
Data from probe recordings in the ICC in individual animals in the combined BDNF + ES group are shown in panels A–E. Each line represents a single probe placement and plots best-depths (lowest threshold location) for monopolar stimulation of the cochlear implant electrodes #1 (most apical) through #6 (most basal). The normal cochleotopic gradient is apparent in a monotonic relationship between the site of cochlear stimulation and ICC depth for all penetrations. Lower frequency (apical) electrodes elicit responses more superficially and higher frequency (basal) best-depths are found deeper, as appropriate for the well-known tonotopic organization of the ICC. (Data are normalized with best-depth for electrode 1 = 0.) For reference, similar plots for three untreated deaf control subjects are shown in panel F.

