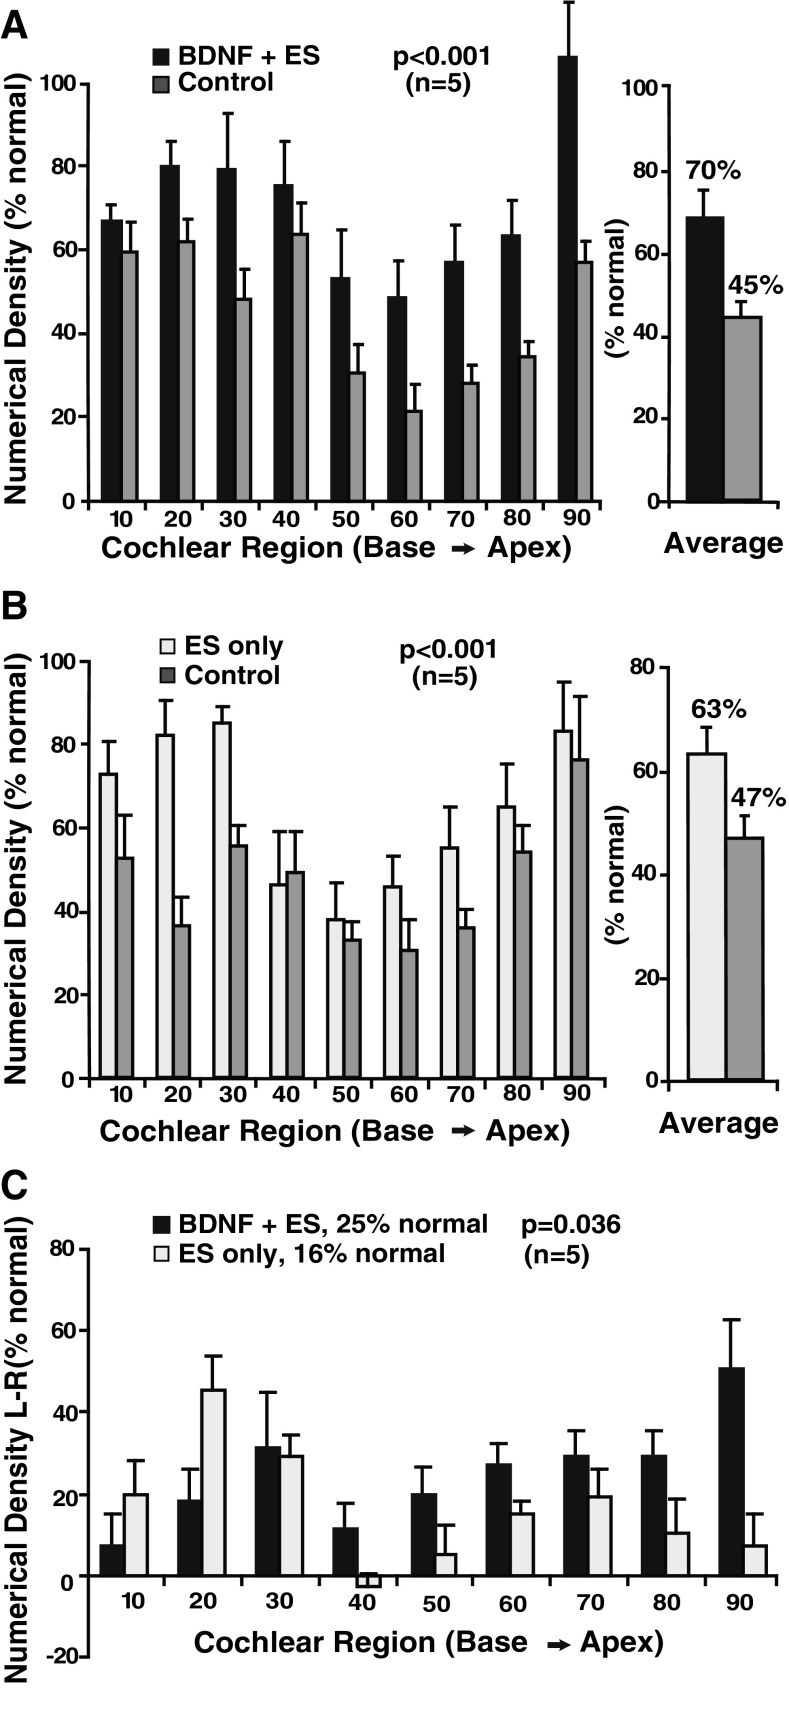
FIG. 3.
A Numerical densities of SG neurons. Data are shown for 10 % cochlear sectors from base to apex, with data expressed as percentage of normal for the same BDNF + ES group shown as in Figure 3A. The BDNF + ES cochleae show higher densities for all cochlear intervals than the paired data for the contralateral ears, although significant neural degeneration occurred on both sides. Averaged over all cochlear sectors, SG cell survival is substantially improved at about 70 % of normal after BDNF + ES, as compared to about 45 % on the opposite side. B Data from the ES-only group also show a significantly higher numerical density in the implanted and stimulated cochleae, compared to contralateral deafened ears. C To directly compare the effects of treatment in the two groups, the difference in numerical density (increase re: contralateral deafened) is shown for both the BDNF + ES group and the ES-only group. (Data presented are means and standard errors.)

