
Figure 2.
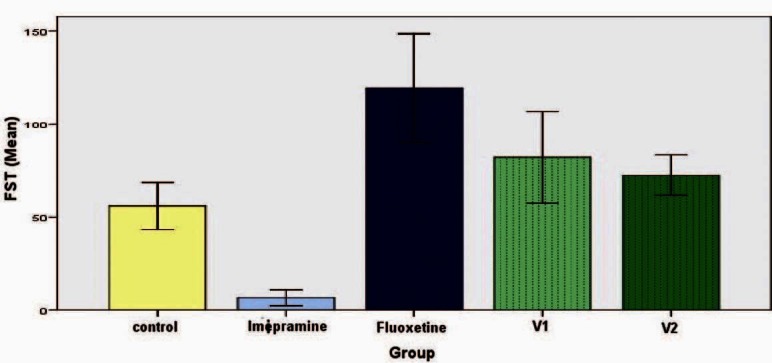
Effect of vanillin on duration of immobility in forced swim test (chronic study). Each histogram represents mean duration of immobility in seconds (n = 6). Vertical line on top represents SD. Values are significant for imipramine when compared with control (P< 0.05)