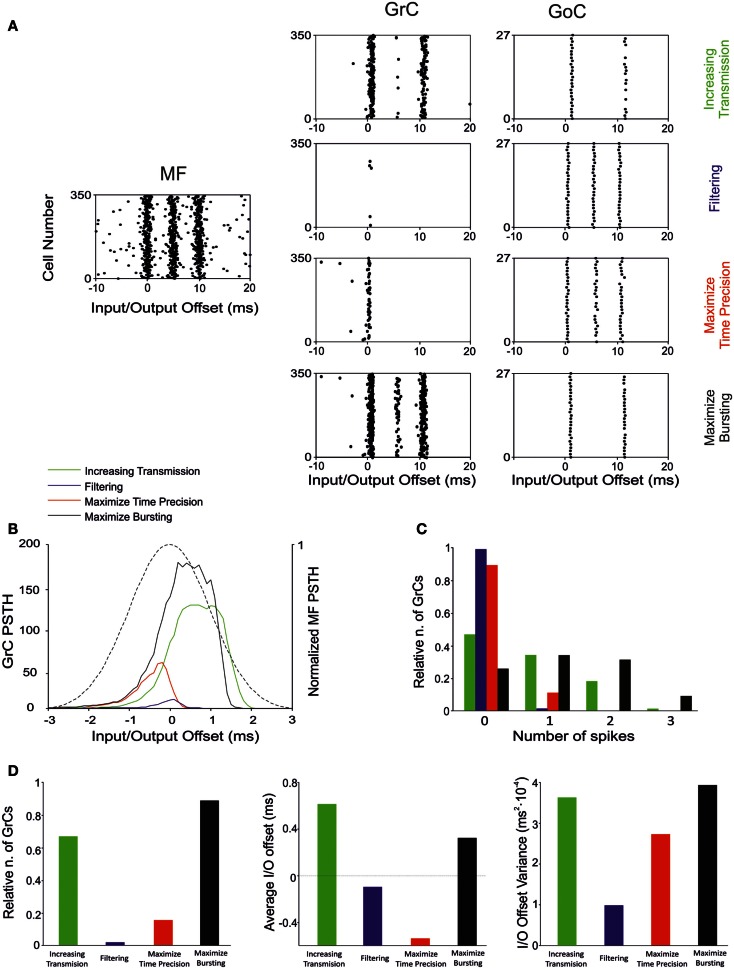
Figure 10.
Effect of suggested weight configurations in the GrC response. In these simulations the weights were set according to the four configurations reported in Table 4: increasing transmission (green), filtering (blue), maximize time precision (red), and maximize bursting (black). (A) Raster plots of the network responses to the same MF stimulation (left) with each weight configuration. Raster plots of activity recorded in the GrC (center) and GoC (right) populations with the hypothesized weight configurations (one per row), respectively. (B) PSTH of the GrC response after the first spike in the burst. (C) Relative number of GrCs generating zero, one, two, or three spikes in response to the stimulation burst. (D) (Left) Relative number of GrCs generating one spike after the first spike in the stimulation burst. Average (center) and offset variance (right) of the spikes elicited by the GrCs in response to the first spike in the burst. Maximize time precision configuration noticeably reduces and anticipate the activity of the GrCs. Increasing transmission configuration enhances the activity in response to the first and second spikes in the burst. Maximize bursting configuration increases the number of doublets and triplets elicited. Finally, filtering configuration nearly avoided the GrCs firing.

