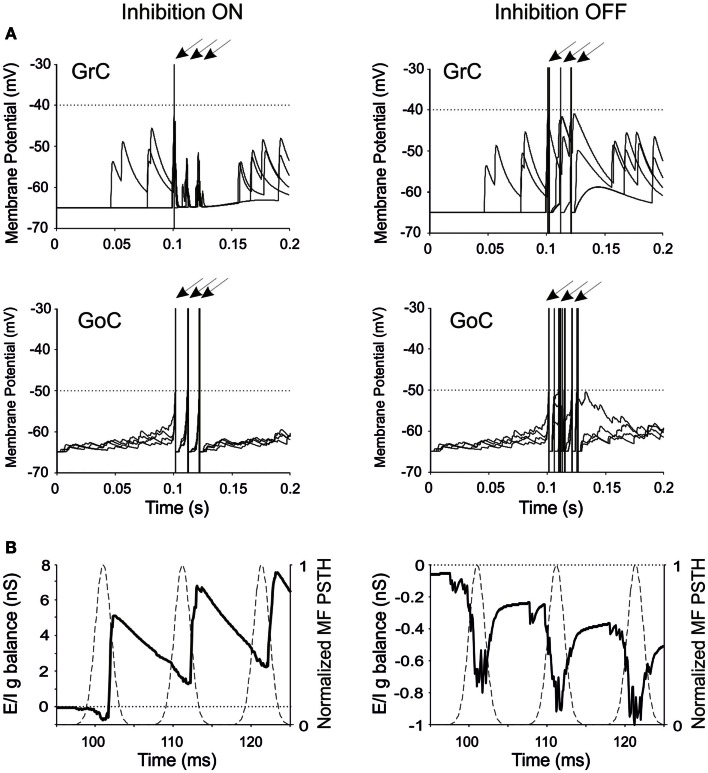
Figure 2.
Neuronal responses and excitatory/inhibitory conductance balance in the granular-layer model. Response of the model to a stimulation burst composed of three spikes at 100 Hz over a 5 Hz background activity generated by random low-frequency firing in the MFs. (A) Electrical response of single GrCs and GoCs in control (inhibition ON) and in the absence of inhibition (inhibition OFF). In each panel, four traces are shown superimposed and arrows indicate the mossy fiber stimulation time. Note that the same seeds are used for initializing the random number generator in all simulations. The GrC and GoC output bursts are much stronger when GoC-GrC inhibition is blocked. Dotted lines represent the threshold potential for each cell model. (B) Average E/I g balance (see Methods) of the GrC population in response to the MF spike burst. Inhibitory conductance is upward, excitatory conductance is downward. In control conditions, the E/I g balance is in favor of excitation only in response to the fist spike, then it turns in favor of inhibition. When inhibition is turned off, the E/I g balance remains always negative.

