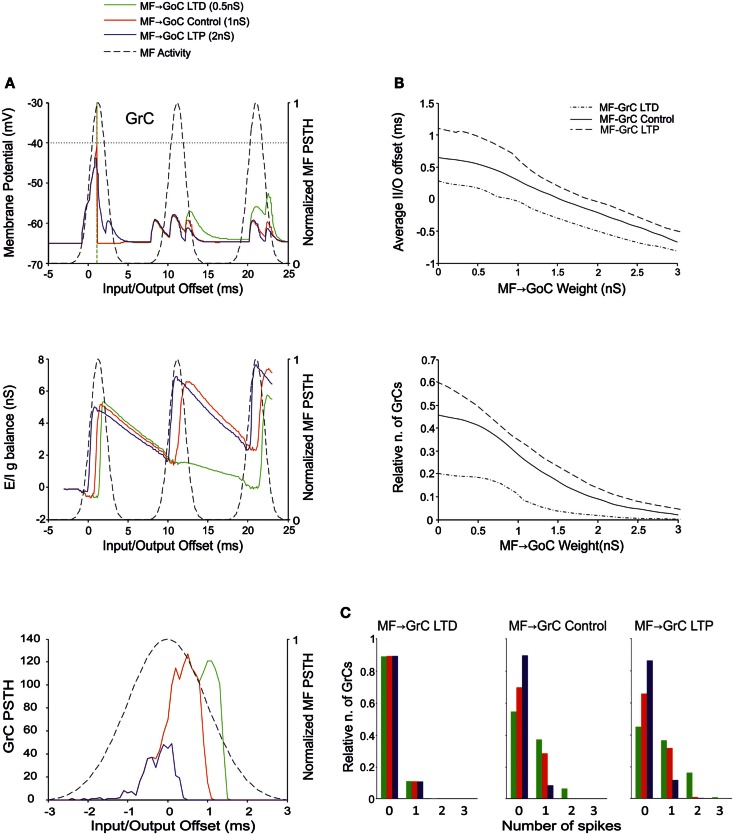
Figure 5.
Effect of MF-GoC synaptic weight on GrC activity. In these simulations the following weight configuration was used: MF-GrC 0.61 nS (LTD), 0.87 nS (control), or 1.87 nS (LTP) (AMPA-receptor weight), MF-GoC 0–3 nS, GrC-GoC 3 nS, GoC-GrC 1.5 nS, SC-GoC 0 nS, GoC-GoC 0 nS. (A) GrC response with MF-GrC control configuration and three different MF-GoC weights: LTD (0.5 nS, green), Control (1 nS, red), and LTP (2 nS, blue). The theoretical distribution of the MF stimulation burst is shown with a dashed line. (Top) Membrane potential in a single GrC and its firing threshold (dotted straight line at −40 mV). (Middle) E/I g balance of the GrC population. (Bottom) PSTH of the GrC response after the first spike in the burst. MF-GoC LTD produces greater and more protracted responses, while the opposite occurs with LTP. (B) Average input/output offset (top) and GrC firing probability (bottom) with respect to MF-GoC weights. The changes observed in conjunction with three different MF-GrC weights are shown for comparison (MF-GrC LTD dot dash line; MF-GrC control solid line; MF-GrC LTP dashed line). (C) Relative number of GrCs generating zero, one, two, or three spikes in response to the stimulation burst. These are reported for three different MF-GrC weights, as specified in (B).

