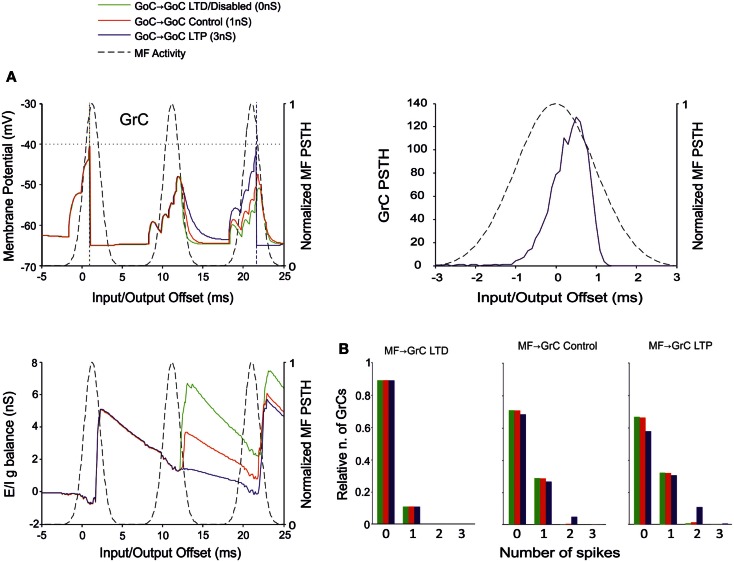
Figure 8.
Effect of GoC-GoC synaptic weight on GrC activity. In these simulations the following weight configuration was used: MF-GrC 0.61 nS (LTD), 0.87 nS (control), or 1.13 nS (LTP) (AMPA-receptor weight), MF-GoC 1 nS, GrC-GoC 3 nS, GoC-GrC 1.5 nS, SC-GoC 0 nS, GoC-GoC 0 nS (LTD/disabled, green), 1 nS (control, red), or 3 nS (LTP, blue). (A) GrC response with MF-GrC control configuration and the three GoC-GoC configurations. The theoretical distribution of the MF stimulation burst is shown with a dashed line. (Top left corner) Membrane potential in a single GrC and its firing threshold (dotted straight line at −40 mV). (Bottom Left) E/I g balance of the GrC population. (Top right corner) PSTH of the GrC response after the first spike in the burst. GoC-GoC did not influence the GrC responsiveness during the initial part of the burst. (B) Relative number of GrCs generating zero, one, two, or three spikes in response to the stimulation burst. These are reported for three different MF-GrC configurations. Note that GoC-GoC LTP configuration noticeably increased the proportion of GrCs that fire doublets in MF-GrC control and LTP configurations.

