
Figure 4. Defects in B2M expression associate with the lack of cell surface HLA-I.
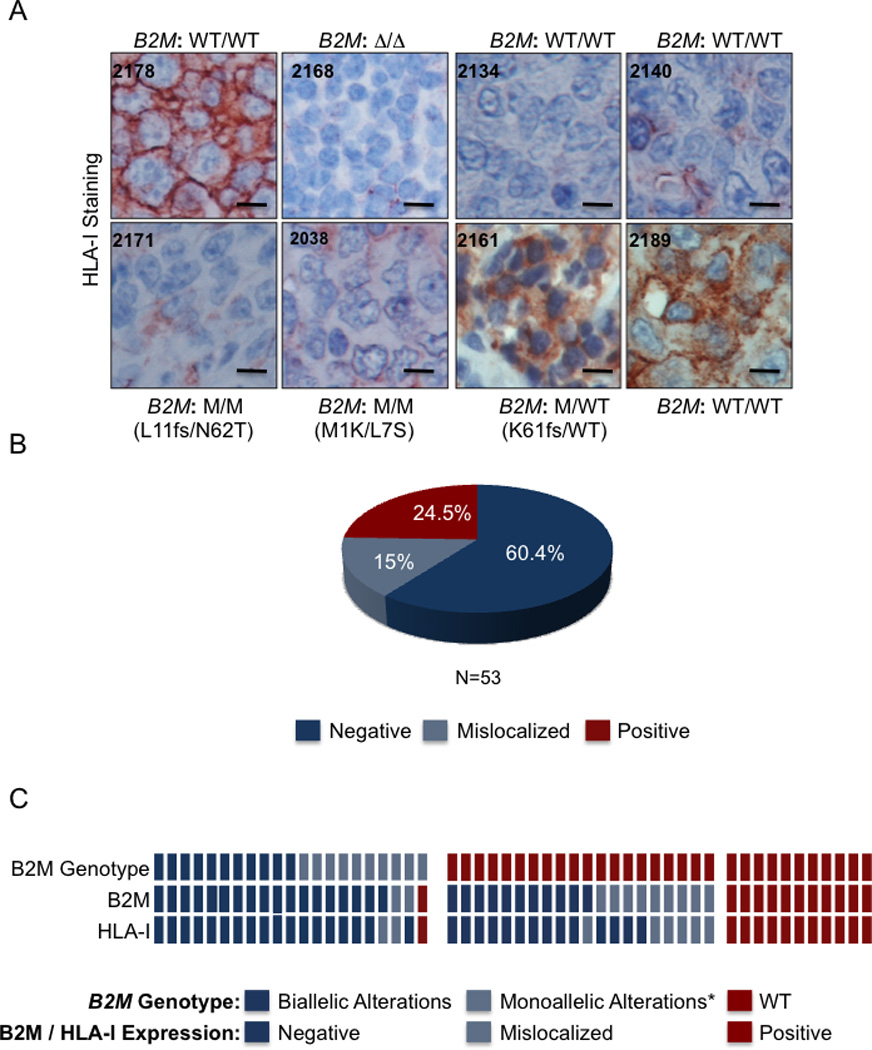
(A) Immunohistochemistry analysis of HLA-I in DLBCL samples using the HC-10 antibody, which recognizes HLA-B and C. The genetic status of B2M is indicated for each sample (Scale = 100 µm). (B) Percentage distribution of DLBCL samples with negative, mislocalized, and positive cell surface expression of HLA-I. (C) Relationship between B2M genetic status and expression of the B2M and HLA-I proteins in DLBCL biopsies. In the heatmap, each column represents one DLBCL sample; the genotype and staining patterns are color-coded as indicated (* this category includes 3 mutated samples where the status of the second allele could not be determined).