Fig. 4.


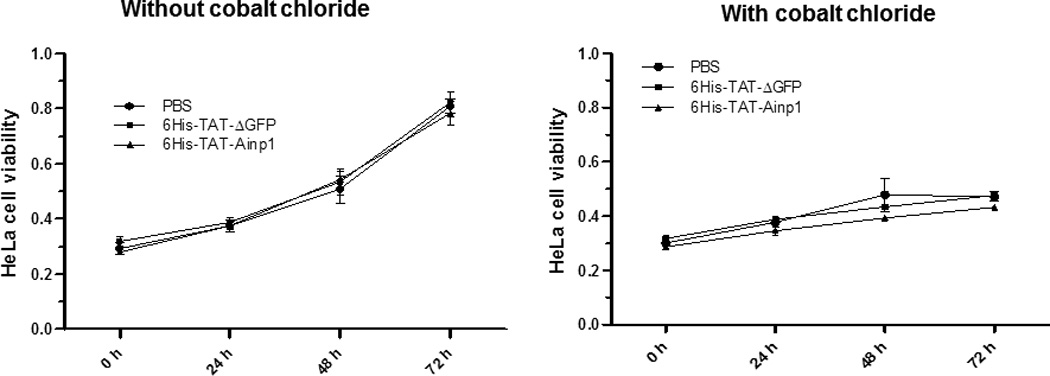
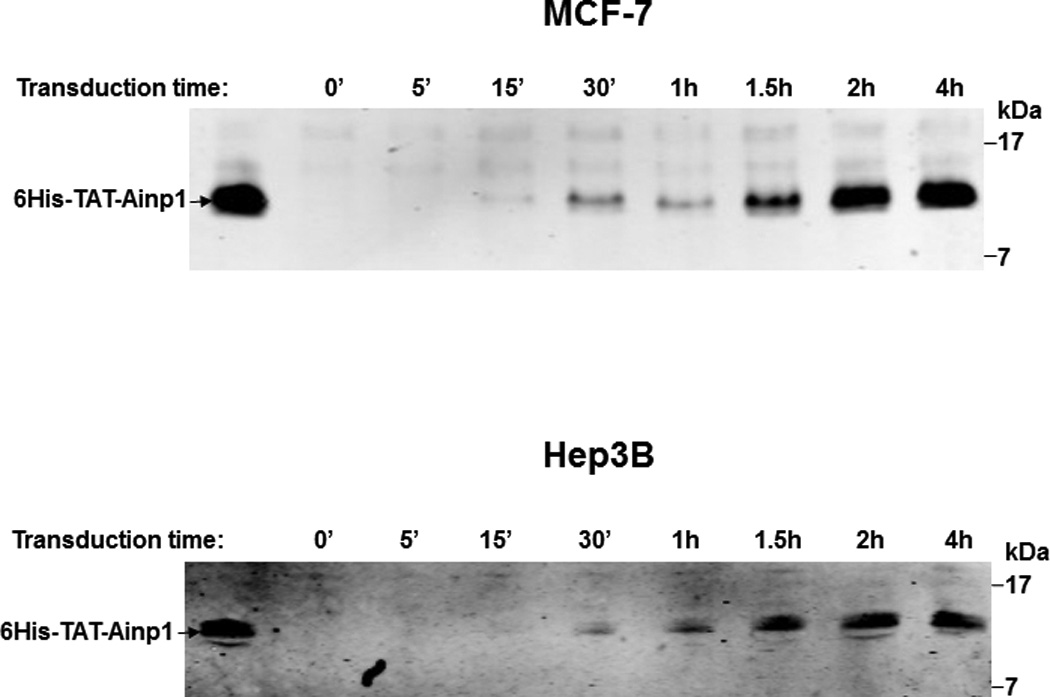
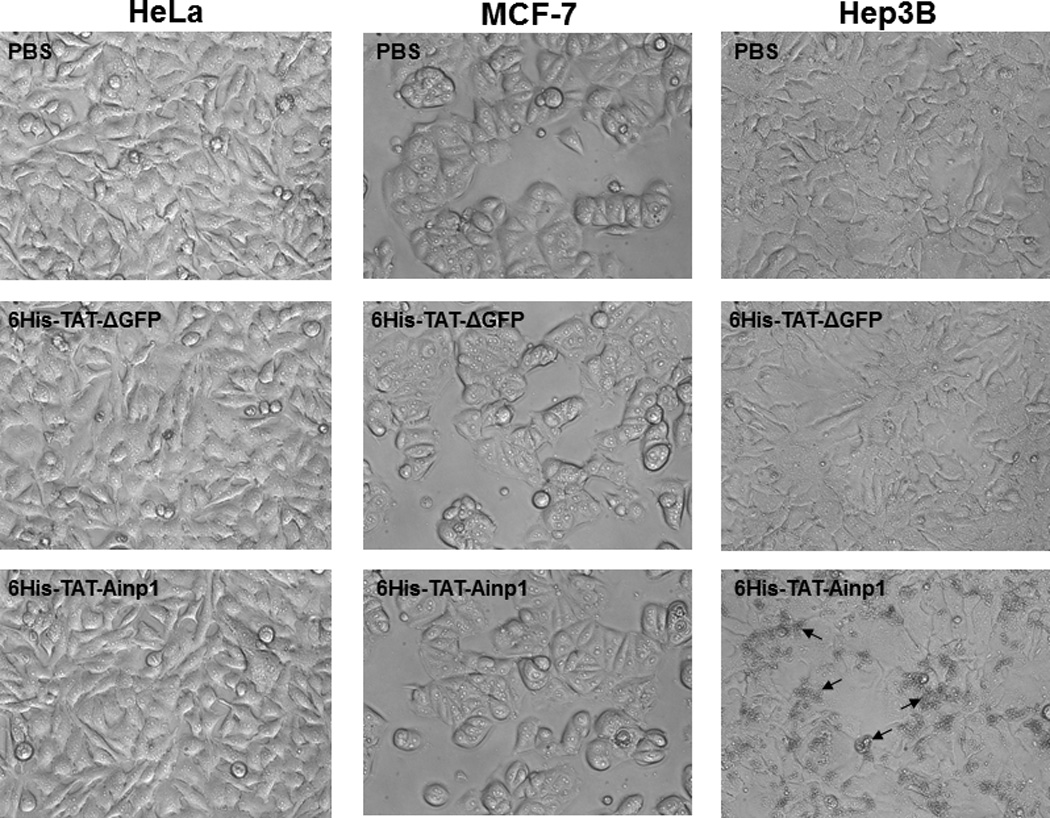
Cell viability assay of 6His-TAT-Ainp1 treatment. (A) Cell viability was measured every 24 h in HeLa cells treated with PBS, 6His-TAT-ΔGFP (2 µM) or 6His-TAT-Ainp1 (2 µM) ± 100 µM cobalt chloride. Error bars indicate the variations of the means (mean ± SD, n = 3). This experiment was repeated once with similar results. (B) Western showing the intracellular 6His-TAT-Ainp1 levels within 4 h of 6His-TAT-Ainp1 (2 µM) treatment in MCF-7 and Hep3B cells. 16% tricine gel was used for analysis [39]. (C) Light microscopy images showing the cell morphology after 24 h of PBS, 6His-TAT-ΔGFP (2 µM) or 6His-TAT-Ainp1 (2 µM) treatment in HeLa, MCF-7 and Hep3B cells. Arrows indicate examples of dead Hep3B cells.
