
Fig. 3.
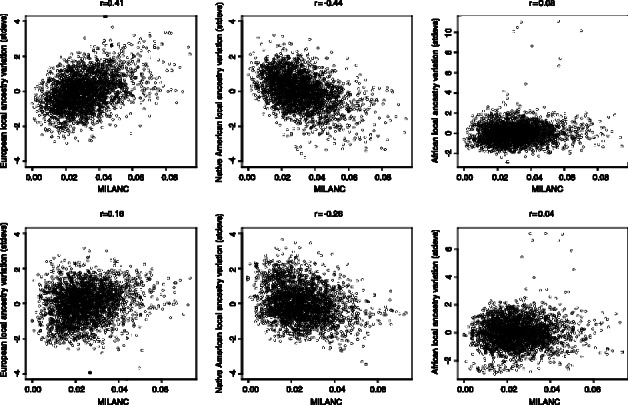
Normalized local ancestry deviation ( ) (EUR, NAM and AFR) versus average MILANC rate
  in the GALA families. Every dot denotes the average across contiguous 1 Mb genomic region. We observe significant correlation of MILANC rates to decreases in NAM ancestry and increases in EUR ancestry for both populations. Errors quantified by MILANC tend to increase EUR local ancestry at the expense of NAM one