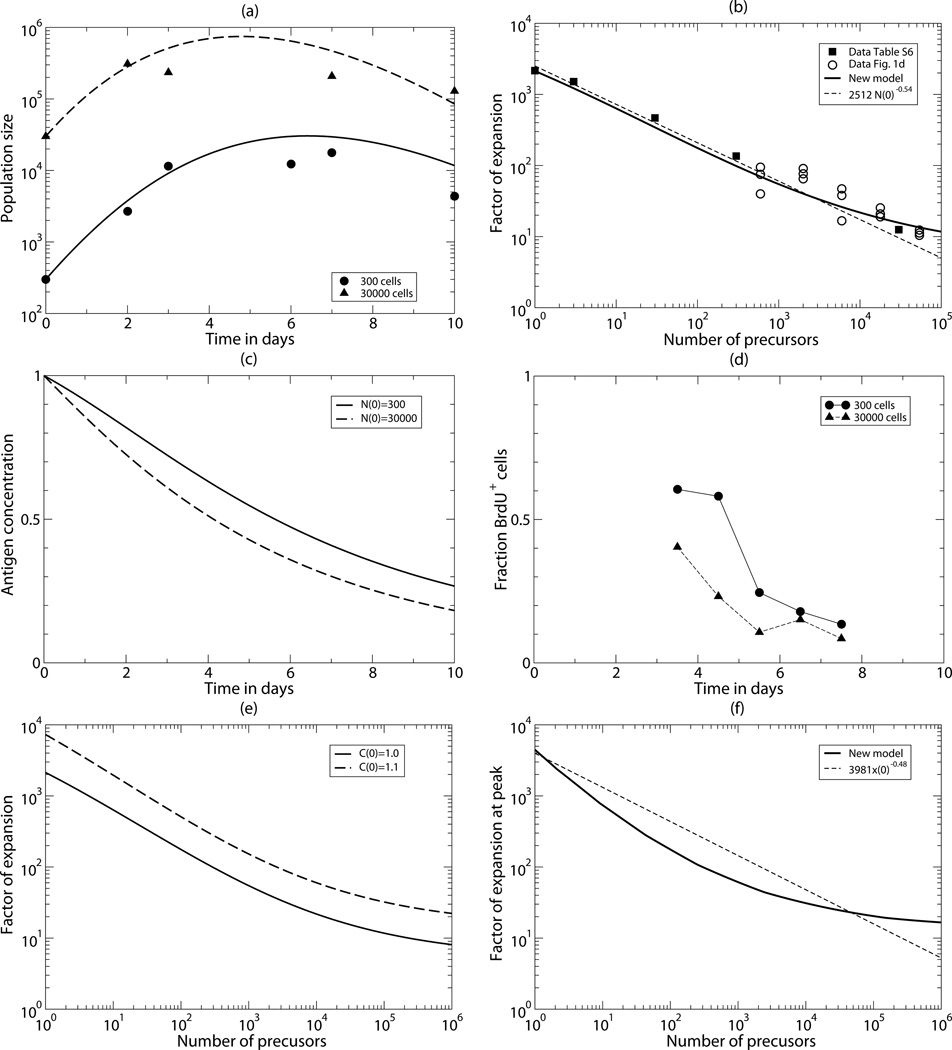
Figure 2.
Comparing the data to the best fit of the new model. (a) The time course of the total number of T cells starting with N(0)=300 (bullets & solid line) or N(0)=30000 (triangles & long-dashed line) CD4+ 5C.C7 T cells. Because the time courses run fairly parallel until day 3, this is in good agreement with the data showing a similar fold expansion at day 3 [7]. (b) The fold expansion, N(7)/N(0)), as a function of the number of precursors, N(0). The heavy line is the prediction of the new model, and the short-dashed line is the regression line 2512×T(0)−0.54 fitted by Bocharov et al., [8]. (c) The pMHC concentration, C, as a measure of the fraction cells entering division. (d) The measured fraction of BrdU+ T cells after a short pulse of 6 hours, which should also be proportional to the fraction of cells entering division. The BrdU data was taken from Table S4 in Bocharov et al., [8]. (e) The effect of 10% increase in the initial antigen concentration. (f) The maximum clone size during the response predicted by the new model (solid line). The short-dashed line is the regression line 3981×N(0)−0.48 fitted to the prediction of the Bocharov et al., [8] model. Parameters were estimated by fitting Eq. (3) to the data in Panels (a) and (b). Their values and confidence intervals are given in Table 1.

