Figure 7.
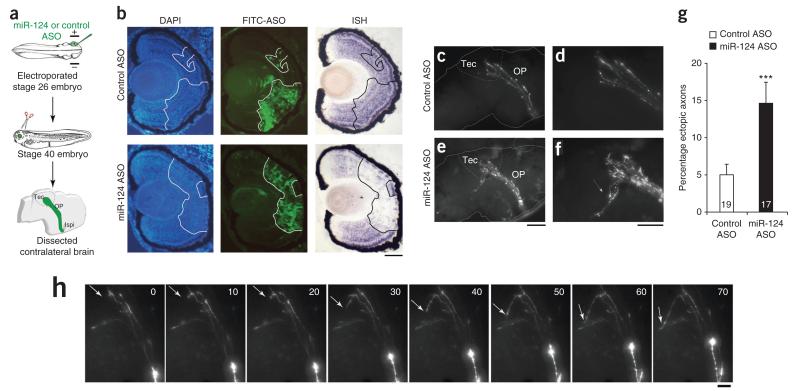
miR-124 acts autonomously to cause retinal axon misrouting (a) Schematic representation of the experiment. ASOs (100 μM morpholino or 18.75 μM LNA knockdown probe) were electroporated. (b) ISH performed on embryos electroporated with fluorescein isothiocyanate (FITC)-labeled morpholino and fixed at stage 40. Cells electroporated with miR-124 ASO were devoid of endogenous miR-124–associated signal, whereas controls showed a strong miR-124–associated signal throughout the retina, even in electroporated cells. (c–f) Fluorescing RGC axons projecting to the contralateral brain (c,e), with corresponding zoomed images (d,f). A subpopulation of axons from RGCs, electroporated with miR-124 ASO, did not stop in the tectum but misprojected ventrally (e,f, arrow), whereas RGC axons all stopped in the tectum in controls (c,d). (g) Number of ectopic axons normalized to the number electroporated RGC axons in the tectum. Unpaired Mann-Whitney U test. Values are mean ± s.e.m., ***P < 0.001. Numbers of optic projections examined are indicated in bars; 556 axons were analyzed in total. (h) Time-lapse imaging of axons misprojecting in the ventral tectum. After reaching the tectum, an axon took a sharp, 90° turn and was misrouted in a distal-ventral direction, instead of stopping and branching within the tectum (arrow). Time is shown in minutes. Images were adjusted for brightness and contrast. Ipsi, ipsilateral; OP, optic projection; Tec, tectum. Scale bars, 50 μm (b); 100 μm (c,e); 50 μm (d,f); 20 μm (h). Embryo images in a modified from ref. 46, copyright 1994 P.D. Nieuwkoop and J. Faber. Reproduced by permission of Taylor and Francis Group, LLC, a division of Informa plc.

