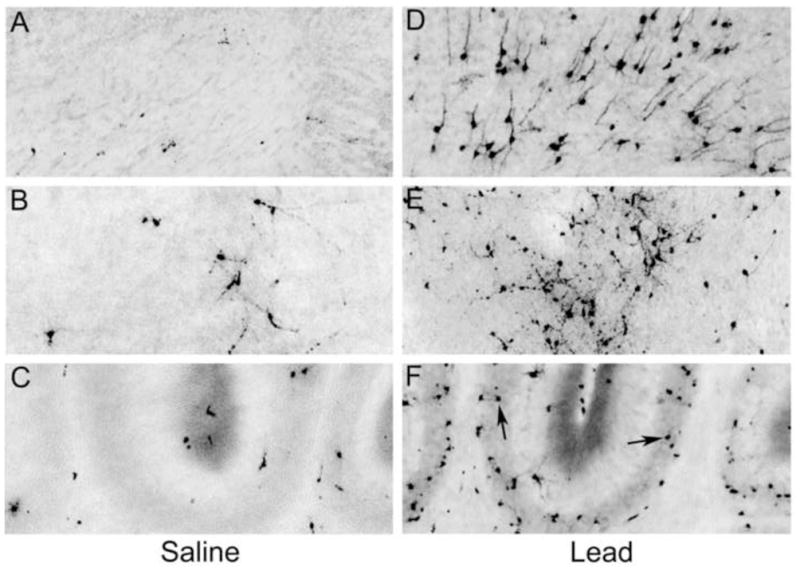
Figure 4.

Panels A, B, and C (control animal) and panels D, E, and F (lead exposed animal) represent their respective images from Figure 3 at a higher magnification. Panels A and D compare a region of deep cortical layers - the pattern of caspase-3 activation in the saline treated animal (A) is more sparse and random compared to that seen in the lead-treated animal (D). Panels B and E compare an area of the caudate/putamen in which there is clearly more caspase-3 positive cells in the lead treated animal (E) versus the saline treated animal (B). Panels C and F demonstrate the vermion region of the cerebellum. The black arrows represent increased caspase-3 activation in the internal granular cell layer of the lead treated animal (F) versus the saline control (C).
