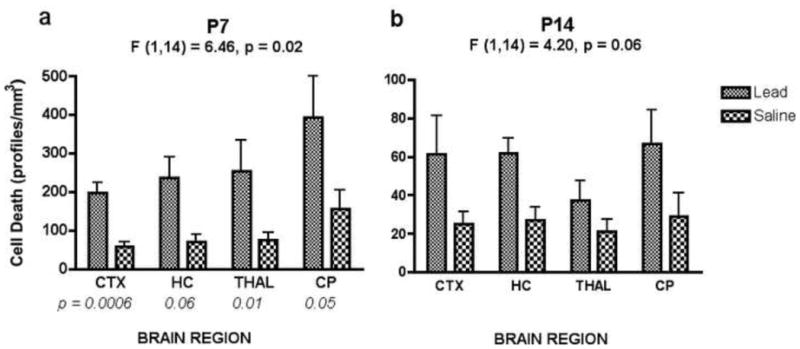
Figure 5.

Results of quantification of cell death in P7 and P14 mice according to brain region (Mean ± SEM; n = 8). A) In animals treated at P7, results showed a significant overall main effect of lead exposure, with every brain region showing an increase in cell death compared to saline controls. Probability values for significance of individual planned comparisons between groups for each brain region are listed below each set of bars. B) At P14, despite increased cell death in each brain region, there was no significant overall treatment effect. Also, note the scale difference of the y-axes for the two age groups. CTX = cortex, HC = hippocampus, THAL = thalamus, CP = caudate/putamen.
