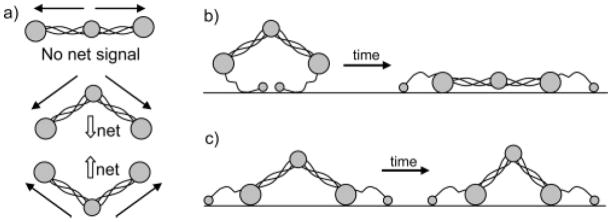
Figure 19.

(a) A few possible fibrinogen configurations at the interface. The α-helix SFG signal from each set of coiled coils is shown by solid arrows, and the net α-helix SFG signal is shown by white arrows. Here αC chains are not shown. (b) Schematic of fibrinogen structural changes with time after adsorption on PEU. (c) Schematic of fibrinogen structural changes with time after adsorption on SPCU or PFP. Reprinted with permission from ref. 200. (2005 American Chemical Society)
