Figure 2.

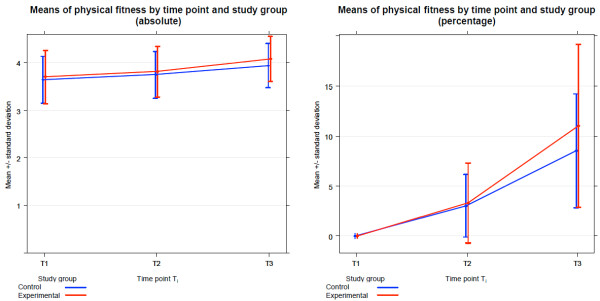
Mean Measured fitness by time point and study group. Progress of fitness (absolute values in W/kg bw and percentage values) at time points T1, T2 and T3 plotted as means and one standard deviation, stratified by study group.

Mean Measured fitness by time point and study group. Progress of fitness (absolute values in W/kg bw and percentage values) at time points T1, T2 and T3 plotted as means and one standard deviation, stratified by study group.