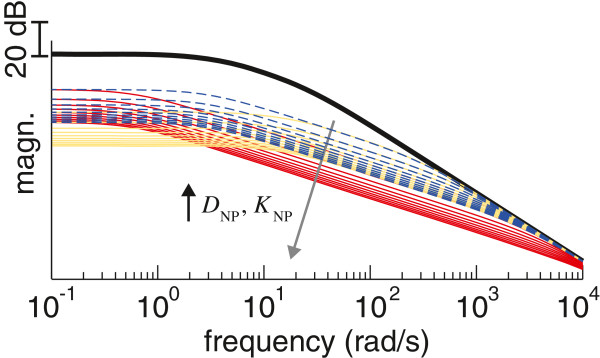
Figure 2.

Rationale behind the tremor suppression approach. Frequency response of a human joint, showing how it is modified by co-contraction of the antagonist muscle pair. The data for the human joint without the neuroprosthesis (black trace) corresponds to the model given in (1) fitted to the parameters identified for the wrist in [39]. The remainder traces represent how the response of the joint is modified by a concurrent increase in viscosity and stiffness (defined as a multiple of the parameters D and K), and correspond to: i) equal increments of DNP and KNP (in multiples of 10, from 10 to 100, shown as blue traces), ii) larger increments of DNP (in multiples of 50, from 50 to 500) than of KNP (in multiples of 10, from 10 to 100, shown as red traces), and iii) larger increments of KNP (in multiples of 50, from 50 to 500) than of DNP (in multiples of 10, from 10 to 100, shown as yellow traces). For all cases, larger values of DNP and KNP cause the response of the joint to have smaller magnitude (as indicated by the arrow in gray).
