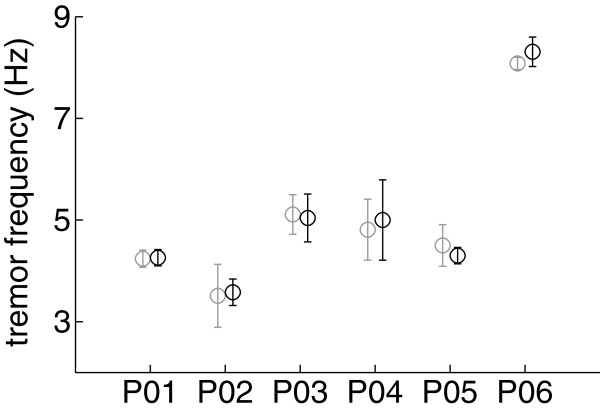
Figure 7.
Effect of the NP on tremor frequency. The plot compares tremor frequency with the NP activated (black) and not activated (gray) for each patient (denoted as PXX, where XX is the patient code). Results are shown as mean (circle) ± SD (whiskers) of the mean frequency for the ensemble of all trials.

