
Figure 2. 2-DE map of cardiac proteins in the mitochondrial and cytosolic fraction.
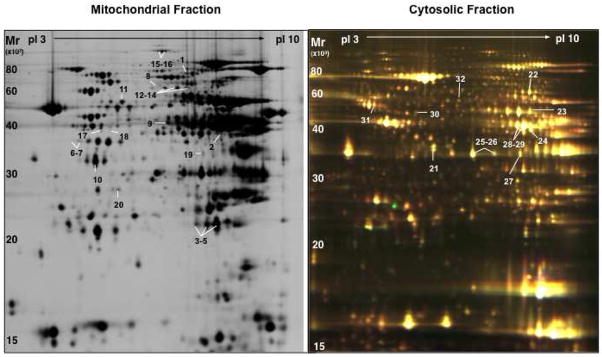
Subcellular protein extracts were pre-labelled with Cy3 and Cy5 using the DIGE approach and co-separated on large format 2-DE gels using pH 3-10NL IPG strips followed by 12% SDS polyacrylamide gels. Images were acquired on a fluorescence scanner and counterstained with silver. A silver-stained image of mitochondrial extracts and a DIGE image of cytosolic extracts is shown in panel A and B, respectively. Analyses using DeCyder® software revealed the spots showing a significant difference in AE or DN hearts. Proteins were numbered and identified by nano-LC MS/MS (Supplemental Table I–III).