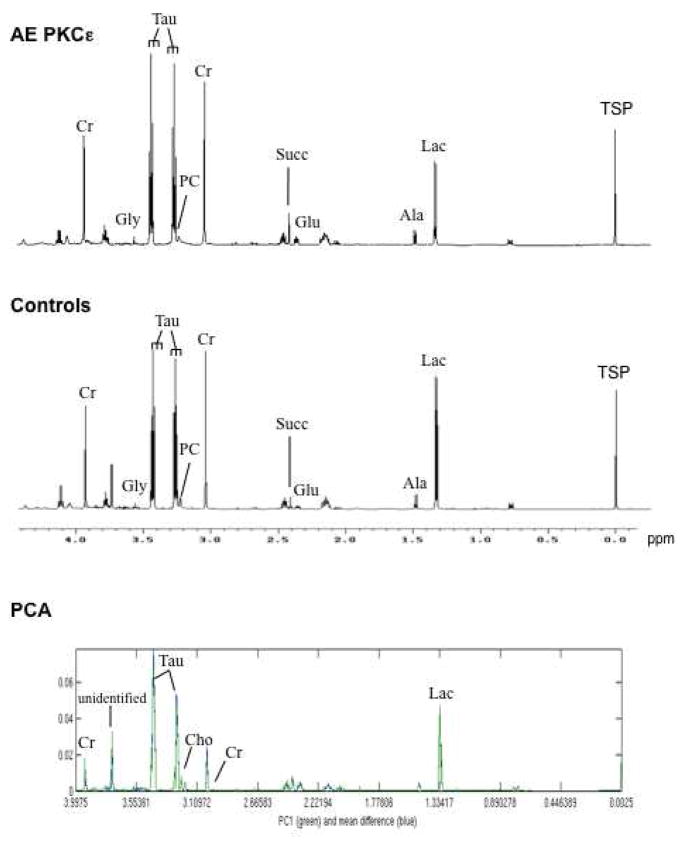
Figure 4. Nuclear magnetic resonance spectra of murine hearts.
Representative high-resolution 1H-NMR spectra of AE PKCε transgenic and control hearts. Within the aliphatic region of the NMR spectra (−0.05 to 4.2 parts per million), resonances have been assigned to 25 metabolites, including creatine (Cr), glycine (Gly), taurine (Tau), phosphocholine (PC), succinate (Succ), glutamate (Glu), alanine (Ala), and lactate (Lac). Sodium 3-trimethylsilyl-2,2,3,3-tetradeuteropropionate (TSP) was added into the samples for chemical shift calibration. The bottom panel shows the first principal component (PC1) and the differences between the two means of metabolites in hearts with and without PKCε activation.

