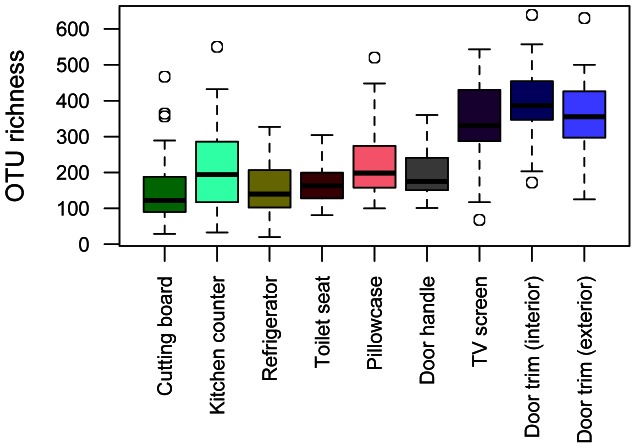
Figure 1. Differences in mean OTU richness across the locations sampled in each of the 40 homes.
OTU richness was calculated as the number of bacterial phylotypes identified out of 1000 reads per sample. Boxes represent 95% confidence intervals. Bars denote minimum and maximum values excluding outliers.

