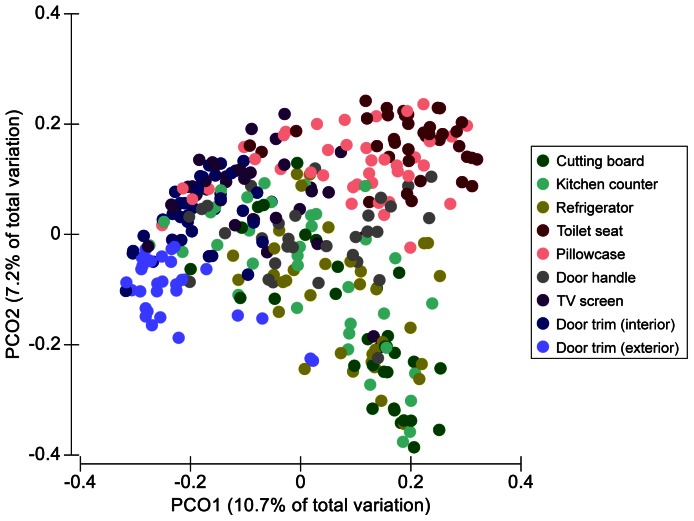
Figure 2. Principal coordinates plot showing overall variation in bacterial community composition among habitats and homes.
Differences in the composition of the bacterial communities were quantified using the unweighted UniFrac distance metric. Symbols are colored by habitat (sample location) with symbols closer together representing samples with more similar bacterial communities.

