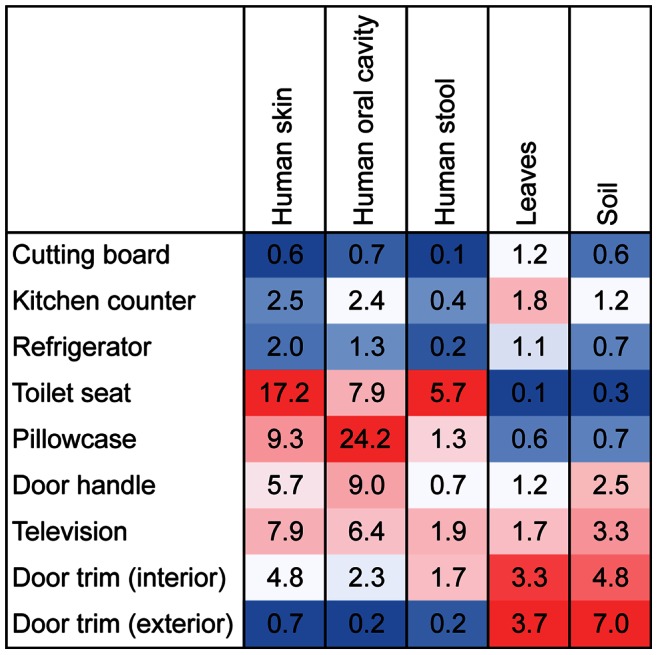
Figure 4. Source tracking analysis showing relative proportion of bacteria at each sampling site associated with given sources.

Values represent median percentages. Warmer colors indicate greater influences of particular sources across the sites. As many of the taxa at a given site could not be attributed to individual sources and some of the sources had more indicator taxa than other sources, these results show changes in the relative importance of individual sources across sites, not comparisons across sources within sites. For example, these results show that soil is a more important source of bacteria on door trims than on cutting boards, but these results cannot be used to directly compare the relative importance of soil versus leaves as sources of bacteria at individual locations.
