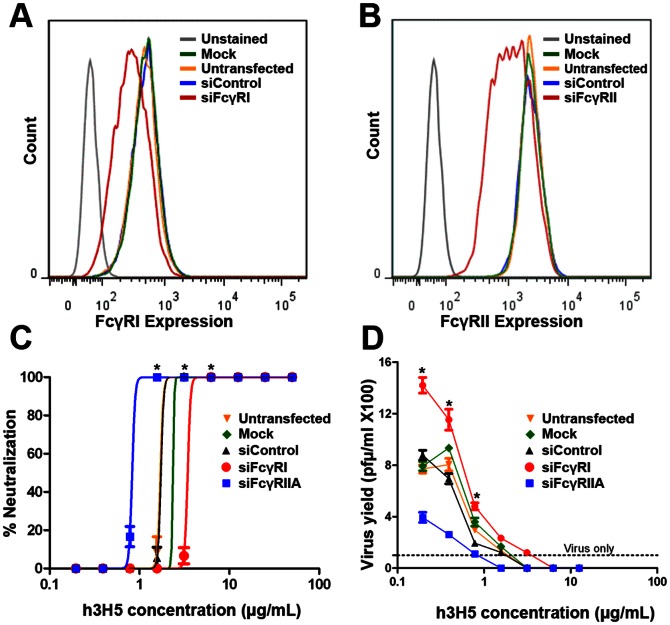
Figure 3. Reduced antibody requirement for neutralization and lowered ADE with FcγRI engagement.
(A) Histogram showing surface expression of FcγRI in THP-1 cells when treated with mock transfection (green), control siRNA (blue), FcγRI siRNA (red) or untransfected (yellow). Unstained (grey) indicates negative control stained with secondary antibody only. (B) Histogram showing surface expression of FcγRII in THP-1 cells when treated with mock transfection (green), control siRNA (blue), FcγRI siRNA (red) or untransfected (yellow). Unstained (grey) indicates negative control stained with secondary antibody only. (C) Neutralization profile of untransfected THP-1 cells (yellow) with mock transfection (green), siRNA control (black), siRNA FcγRI (red) or siRNA FcγRIIA (blue), 72 h post infection, as assessed by plaque assay. (D) Virus yield from THP-1 treated with control siRNA, FcγRI siRNA and FcγRIIA siRNA at 72 h post infection, as assessed by plaque assay. Although knockdown efficiency may vary between experiments, we observed similar trends. * p<0.01. Graphs shown are mean ± s.d of biological triplicates of a single experiment from three independent experiments.

