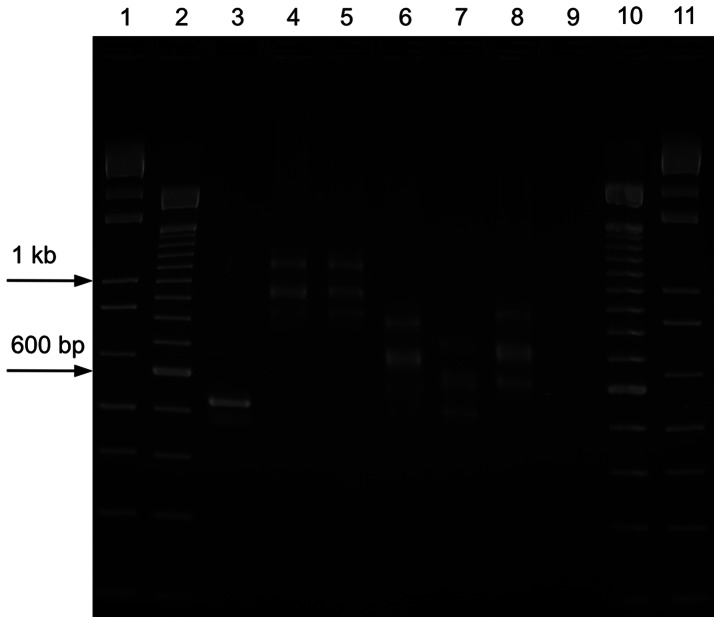
Figure 3. PCR products of the bovine µ, δ, γ1 to 3, ε, and α isotypes.
The amplicons of the heavy chain variable domain of each bovine isotype were resolved by 2.5% agarose gel electrophoresis and revealed three distinct products. Lanes 1 and 11∶1kb ladder, lanes 2 and 10∶100 bp ladder. Lane 1: product of the GAPDH positive control; Lanes 4 and 5: in the products of µ and δ, a faint lower band was noticed also with differences in size of 100 bp. The middle and upper bands showed strong amplification. Lanes 6 to 8: the dominant product of isotypes γ1 to 3, ε, and α was observed in the middle with a size difference of about 100 bp compared to both the upper and the lower band. Lane 9 is the no template negative control of the PCR.

