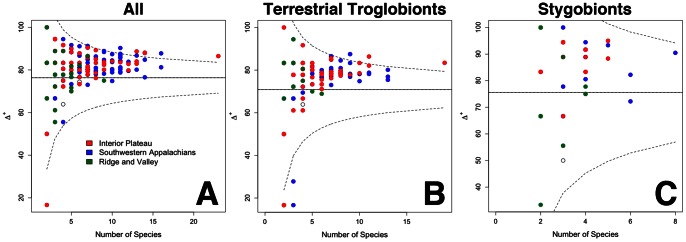
Figure 2. Average taxonomic distinctness (Δ+) for caves of Tennessee: (a) all troglobionts, (b) terrestrial troglobionts only, and (c) stygobionts only.

Each point represents a cave. Ecoregions are color-coded. The solid line is the simulated mean value and the funnel curve shows the 95% confident limits of expected values.
