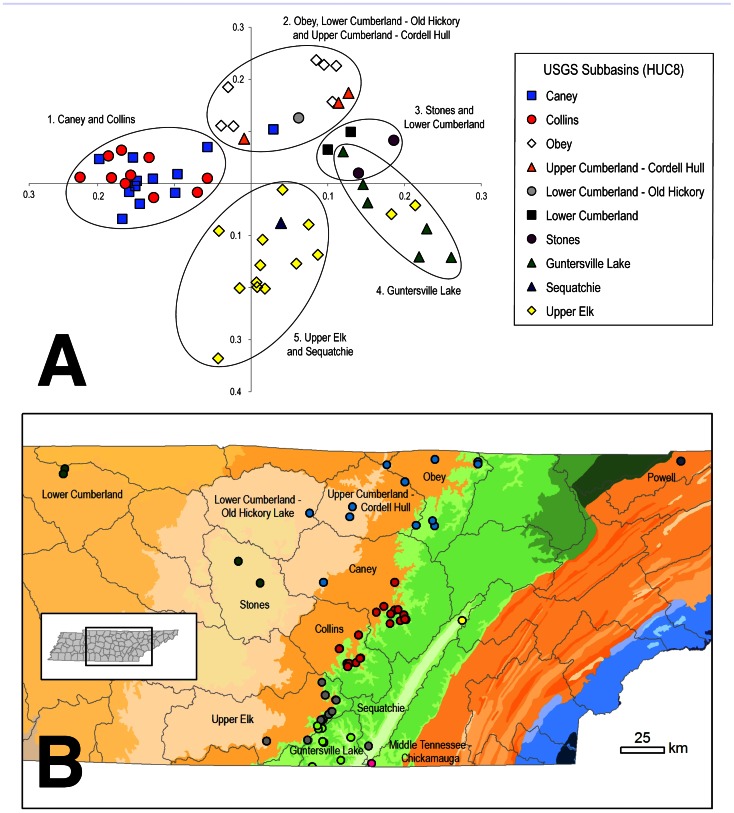
Figure 8. Zoogeographic regions for troglobionts of Tennessee.
(a) Principal Components Analysis for 58 caves with eight or more known troglobionts. PCA Axes 1 and 2 correspond to the X and Y axes, respectively. Each point on the PCA represents a single cave, and caves with similar proximity between points indicate similarity between the troglobiont communities of those caves. Each cave is colored to reflect its location in one of the U.S. Geological Survey-defined (HUC8) watershed subbasins. Five clusters representing geographically contiguous groupings of caves are circled and labeled. (b) Locations of caves color-coded by their clusters on the PCA. Also included are three caves (one each from the Powell, Sequatchie, and Middle Tennessee–Chickamauga subbasins) that were excluded from the PCA analysis as extreme outliers and that had highly distinct troglobiont communities. Watershed boundaries are overlain on ecoregions colored as in Figure 1.

