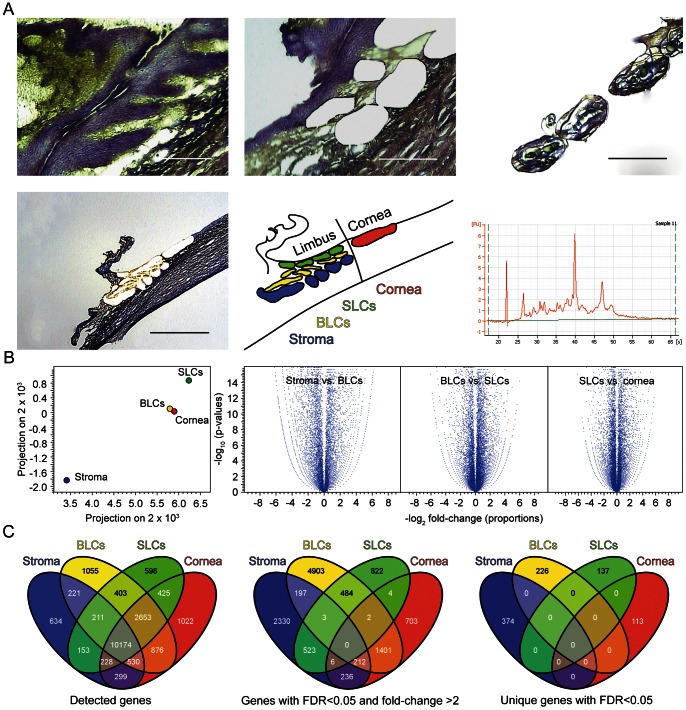
Figure 1. LCM of the corneal limbus and comparison of the compartment-specific libraries.
(A) Representative images from the LCM procedure and the electropherogram of the isolated RNA. Scale bars high power magnification, 200 µm; low power magnification, 1 mm. (B) Principal component analysis and volcano plots of the compartment-specific libraries. (C) Distribution of transcriptional expression between limbal compartments using four-way Venn Diagrams.

