
Figure 5. Comparative gene ontology analysis of significantly enriched terms between BLCs and SLCs.
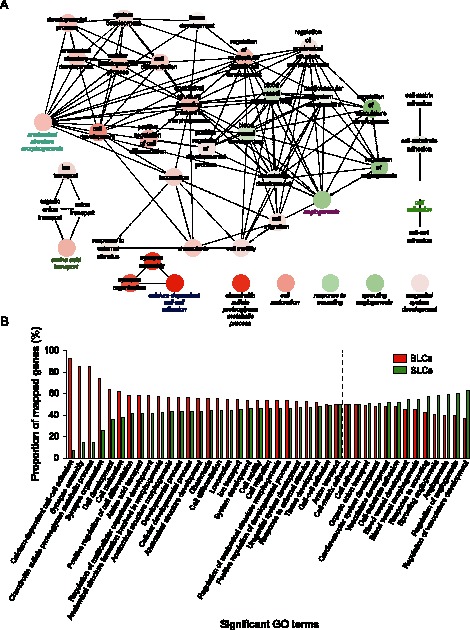
(A) Network of significantly enriched terms. (B) Bar chart of significantly enriched terms. The stippled line indicates gene equilibrium.
Official websites use .gov
A
.gov website belongs to an official
government organization in the United States.
Secure .gov websites use HTTPS
A lock (
) or https:// means you've safely
connected to the .gov website. Share sensitive
information only on official, secure websites.
(A) Network of significantly enriched terms. (B) Bar chart of significantly enriched terms. The stippled line indicates gene equilibrium.