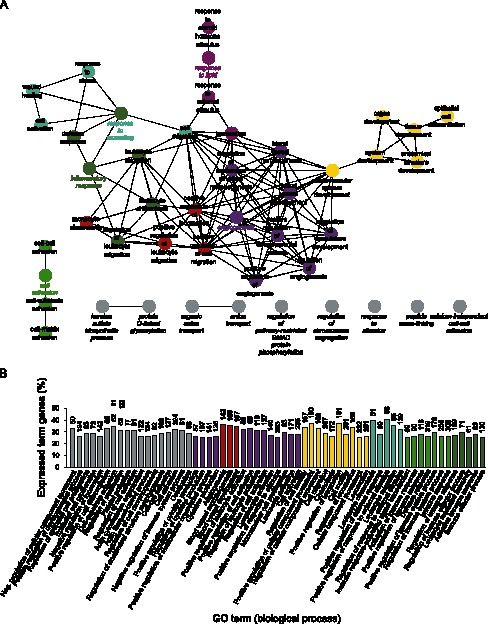
Figure 7. Gene ontology analysis of significantly upregulated genes in stroma.

(A) Network of significantly enriched terms. (B) Bar chart of significantly enriched terms. Numbers next to the bars indicate total number of genes mapping to the specific term.
