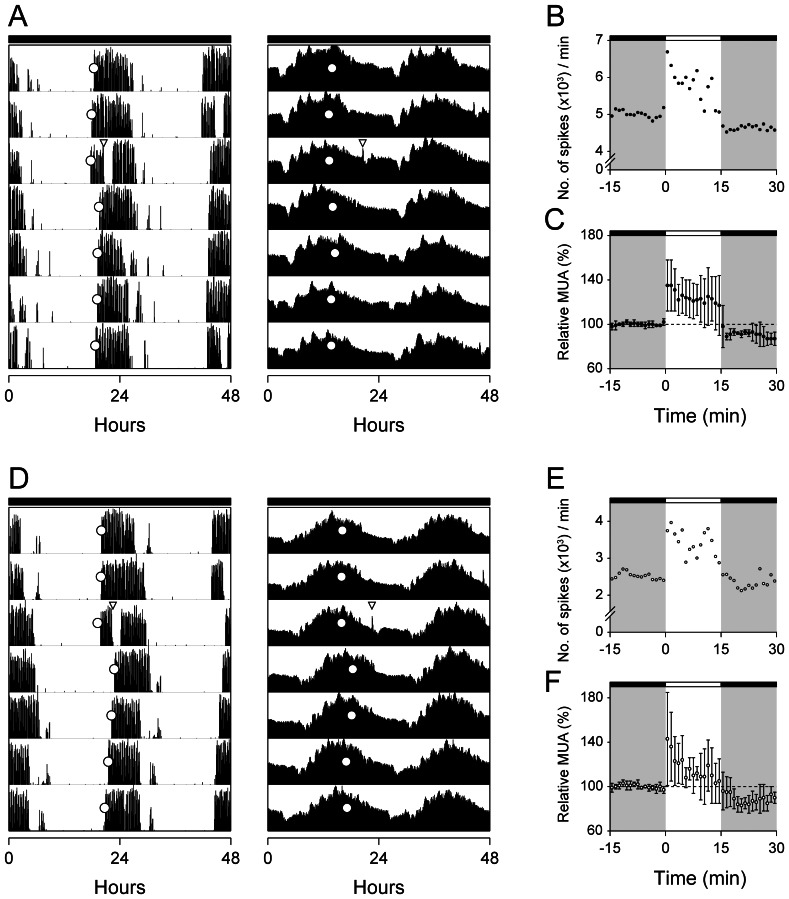
Figure 4. Behavioral and SCN responses to light.
Representative double-plotted actograms of wheel-running activity (left panels) and multi-unit neural activity in the SCN (right panels) of wild-type (A) and Per1 −/− (D) mice. Each line represents two consecutive days (48 hr), with time in 6-min bins plotted left to right. Consecutive days are aligned vertically. The mice were maintained in constant darkness (indicated by the black bars above actograms) and a 15-min light pulse (100 lux) was administered 3 hr after activity onset (CT15; open inverted triangle). Open circles indicate the respective phase markers: activity onset for wheel-running activity and acrophase for MUA. The magnitudes of phase shifts were determined by measuring the phase differences between least-squares fitted regression lines through the respective phase markers before and after the light pulse [locomotor: −2.20 h, MUA: −1.94 h in (A); locomotor: −3.24 h, MUA:−2.60 h in (D)]. To show the acute response of the SCN to light, MUA data (plotted in 1-min bins) surrounding the light pulse in (A) and (D) are magnified in (B) and (E), respectively. The time of the light pulse is indicated by the open bars at the tops of the figures and dark is indicated by gray shading. Mean (±SD) MUA responses in wild-type (C; n = 4) and Per1−/− (F; n = 4) SCN are shown relative to baseline (baseline determined from the mean counts 15 min before the light pulse and set to 100% in wild-type and Per1 −/− mice).

