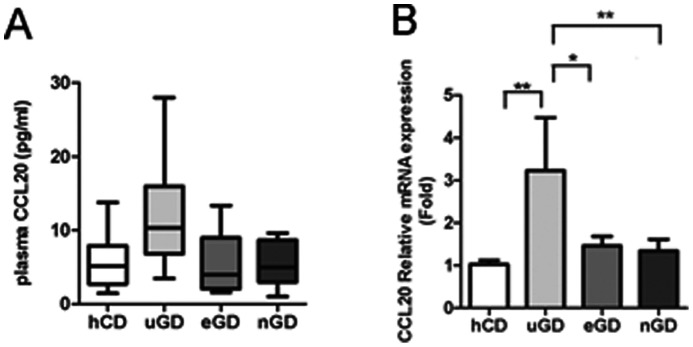
Figure 1. Plasma CCL20 and CCL20 mRNA in CD4+T cells from GD patients and normal controls.

(A) Distribution of plasma CCL20 levels in 35 healthy control donors, 50 untreated GD patients, 15 euthyroid GD patients and 12 TRAb-negative GD patients. Median values, interquartile ranges and ranges are denoted by horizontal bars, boxes and vertical bars, respectively. (B) CCL20 mRNA levels in CD4+T cells from healthy controls, uGD, eGD and nGD patients. Data were presented as mean±SEM.*, P<0.05; **, P<0.01.
