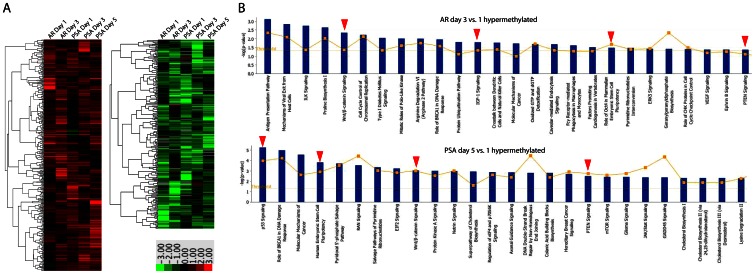
Figure 8. Identification of DNA methylation changes in prostatic differentiation using E-PZ-1-iPS-4 cells.
(A) Genes that showed significantly higher (in red) or lower (in green) levels of methylation in cells cultured under AR- or PSA- inducing conditions compared to control across different time points of the induction process. (B) Canonical pathways identified by IPA that are enriched with genes hypermethylated in AR and PSA induced cells at late time points compared to early time point. Red arrows point out key pathways known to be involved in prostatic cell differentiation.

