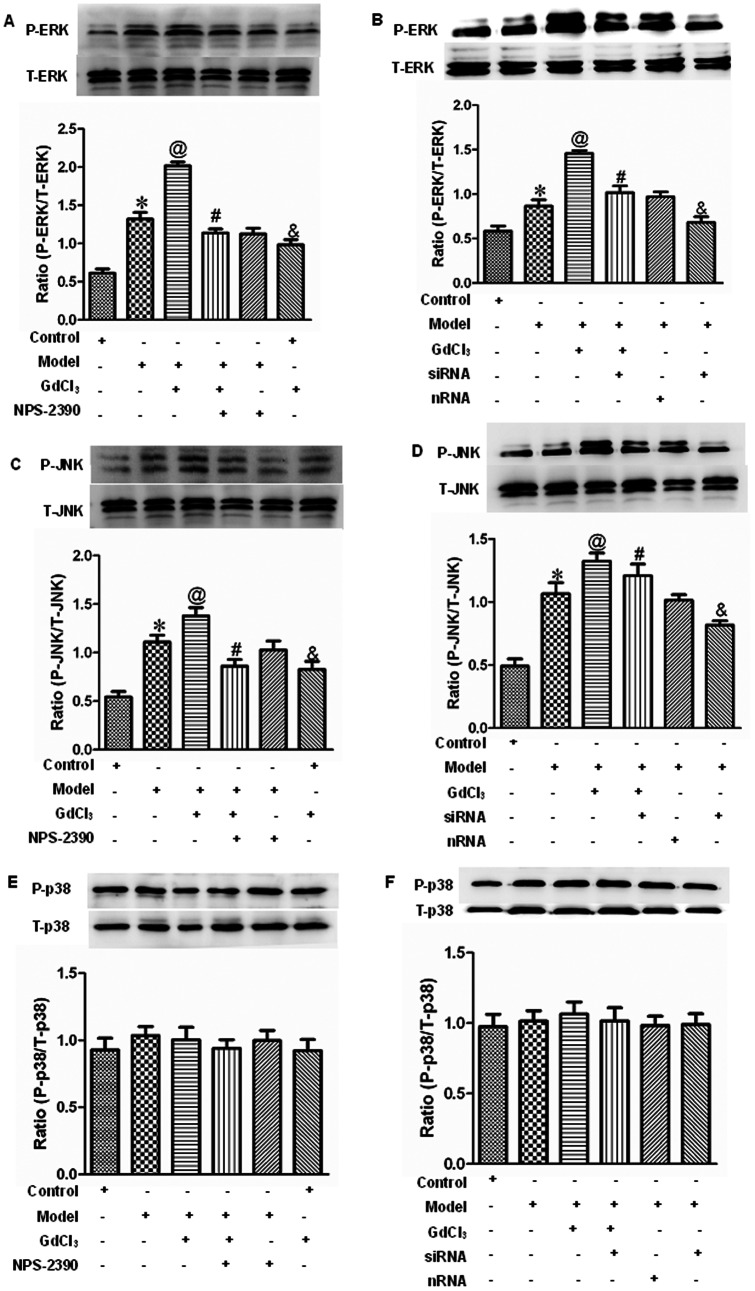
Figure 9. ERK1/2, JNK, and p38 phosphorylation in neonatal rat myocytes in different groups.
Western blotting for phosphorylated ERK1/2 (A and B), JNK (C and D), p38 (E and F), as well as total ERK1/2, JNK, p38 of cardiomyocytes. All the data were expressed as mean±SEM (n = 6). *P<0.05 compared with control group; @P<0.05 compared with model group; #P<0.05 compared with model+GdCl3 group; &P<0.05 compared with control group. Groups in A, C and E were control, model, model+GdCl3, model+NPS-2390+GdCl3, model+NPS-2390, and control+GdCl3. Groups in B, D and F were control, model, model+GdCl3, siRNA+model+GdCl3, nRNA+model, and siRNA+model. Glucose: 25.5 mM; GdCl3: 300 µM; NPS-2390: 10 µM.

