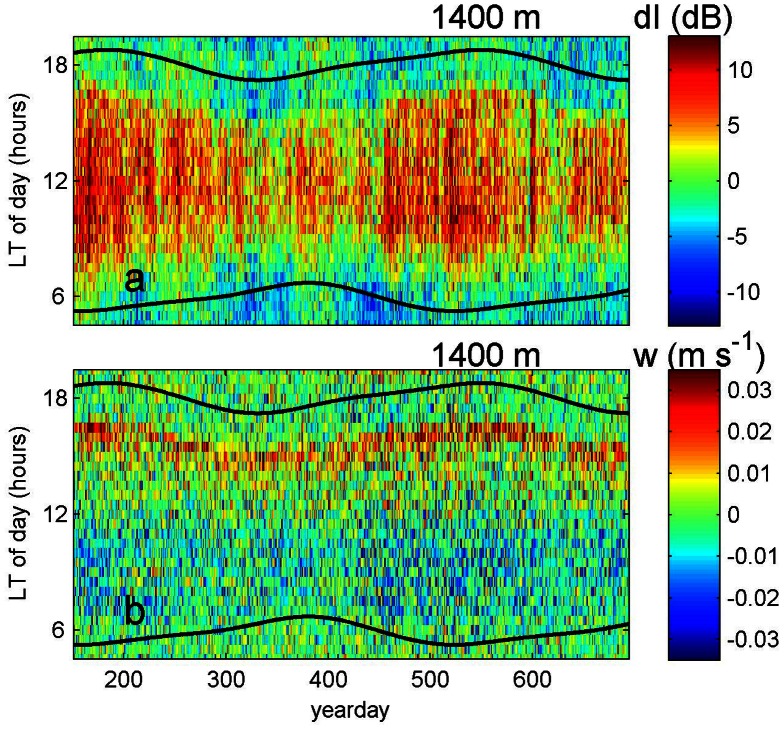
Figure 2. DVM-variations in day length inferred from raw data of Figure 1 at z = −1400 m, grouped in 24 hour (daily) periods.
(a) Relative echo intensity. (b) Vertical current; note the much clearer upward migration of the plankton, confined in a shorter period, compared with the less clear downward migrations. In both panels, the black lines denote times of local sunrise and sunset.

