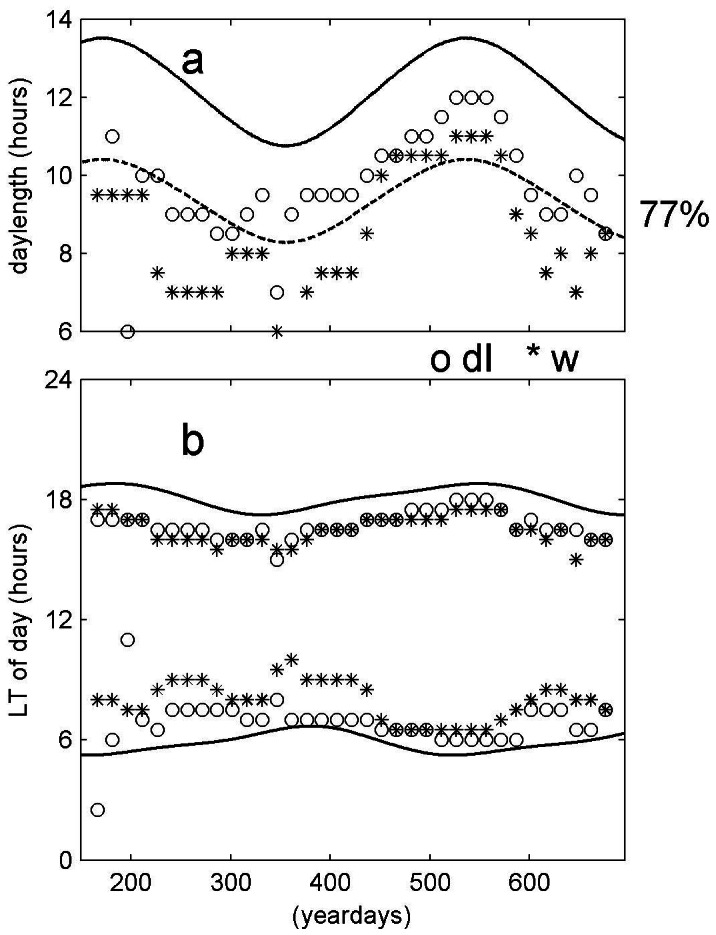
Figure 3. Seasonal DVM-variations in day length experienced by the plankton, as calculated in half-overlapping steps from monthly data as in Figure 1b (o) and Figure 1e (*) for z = −1021 m.

Thick solid lines indicate the times of true local day length determined from the sun. (a) Total day length; dashed line is the solid line multiplied by a factor of 77%. This factor is the average day length determined from plankton DVM, being slightly larger for dI-determined day length (o) and slightly smaller for w-determined day length (*). (b) Near sunrise and sunset.
